
Exoplanet Plots
On this page we present a selection of pre-generated exoplanet plots. Additional details about these plots may be found in the About These Plots section of this page and on our ExoPlots User's Guide page. If you use any of these plots in your presentation materials, please acknowledge the NASA Exoplanet Archive.
Note that the interactive widgets linked here only allow plotting of the subset of pre-selected data shown on this page. To make your own plots with Exoplanet Archive data, with all current parameter holdings available, go to the relevant tables (Planetary Systems, Planetary Systems Composite Data, Stellar Hosts, Cumulative KOIs, TESS Project Candidates) and use the Scatter Plot and Histogram Plot tools (under the Plot Table menu).
Skip to a Section:
- Confirmed Planets
- Kepler Candidates
- TESS Candidates
- JWST Atmosphere Observation List
- Movies
- About These Plots
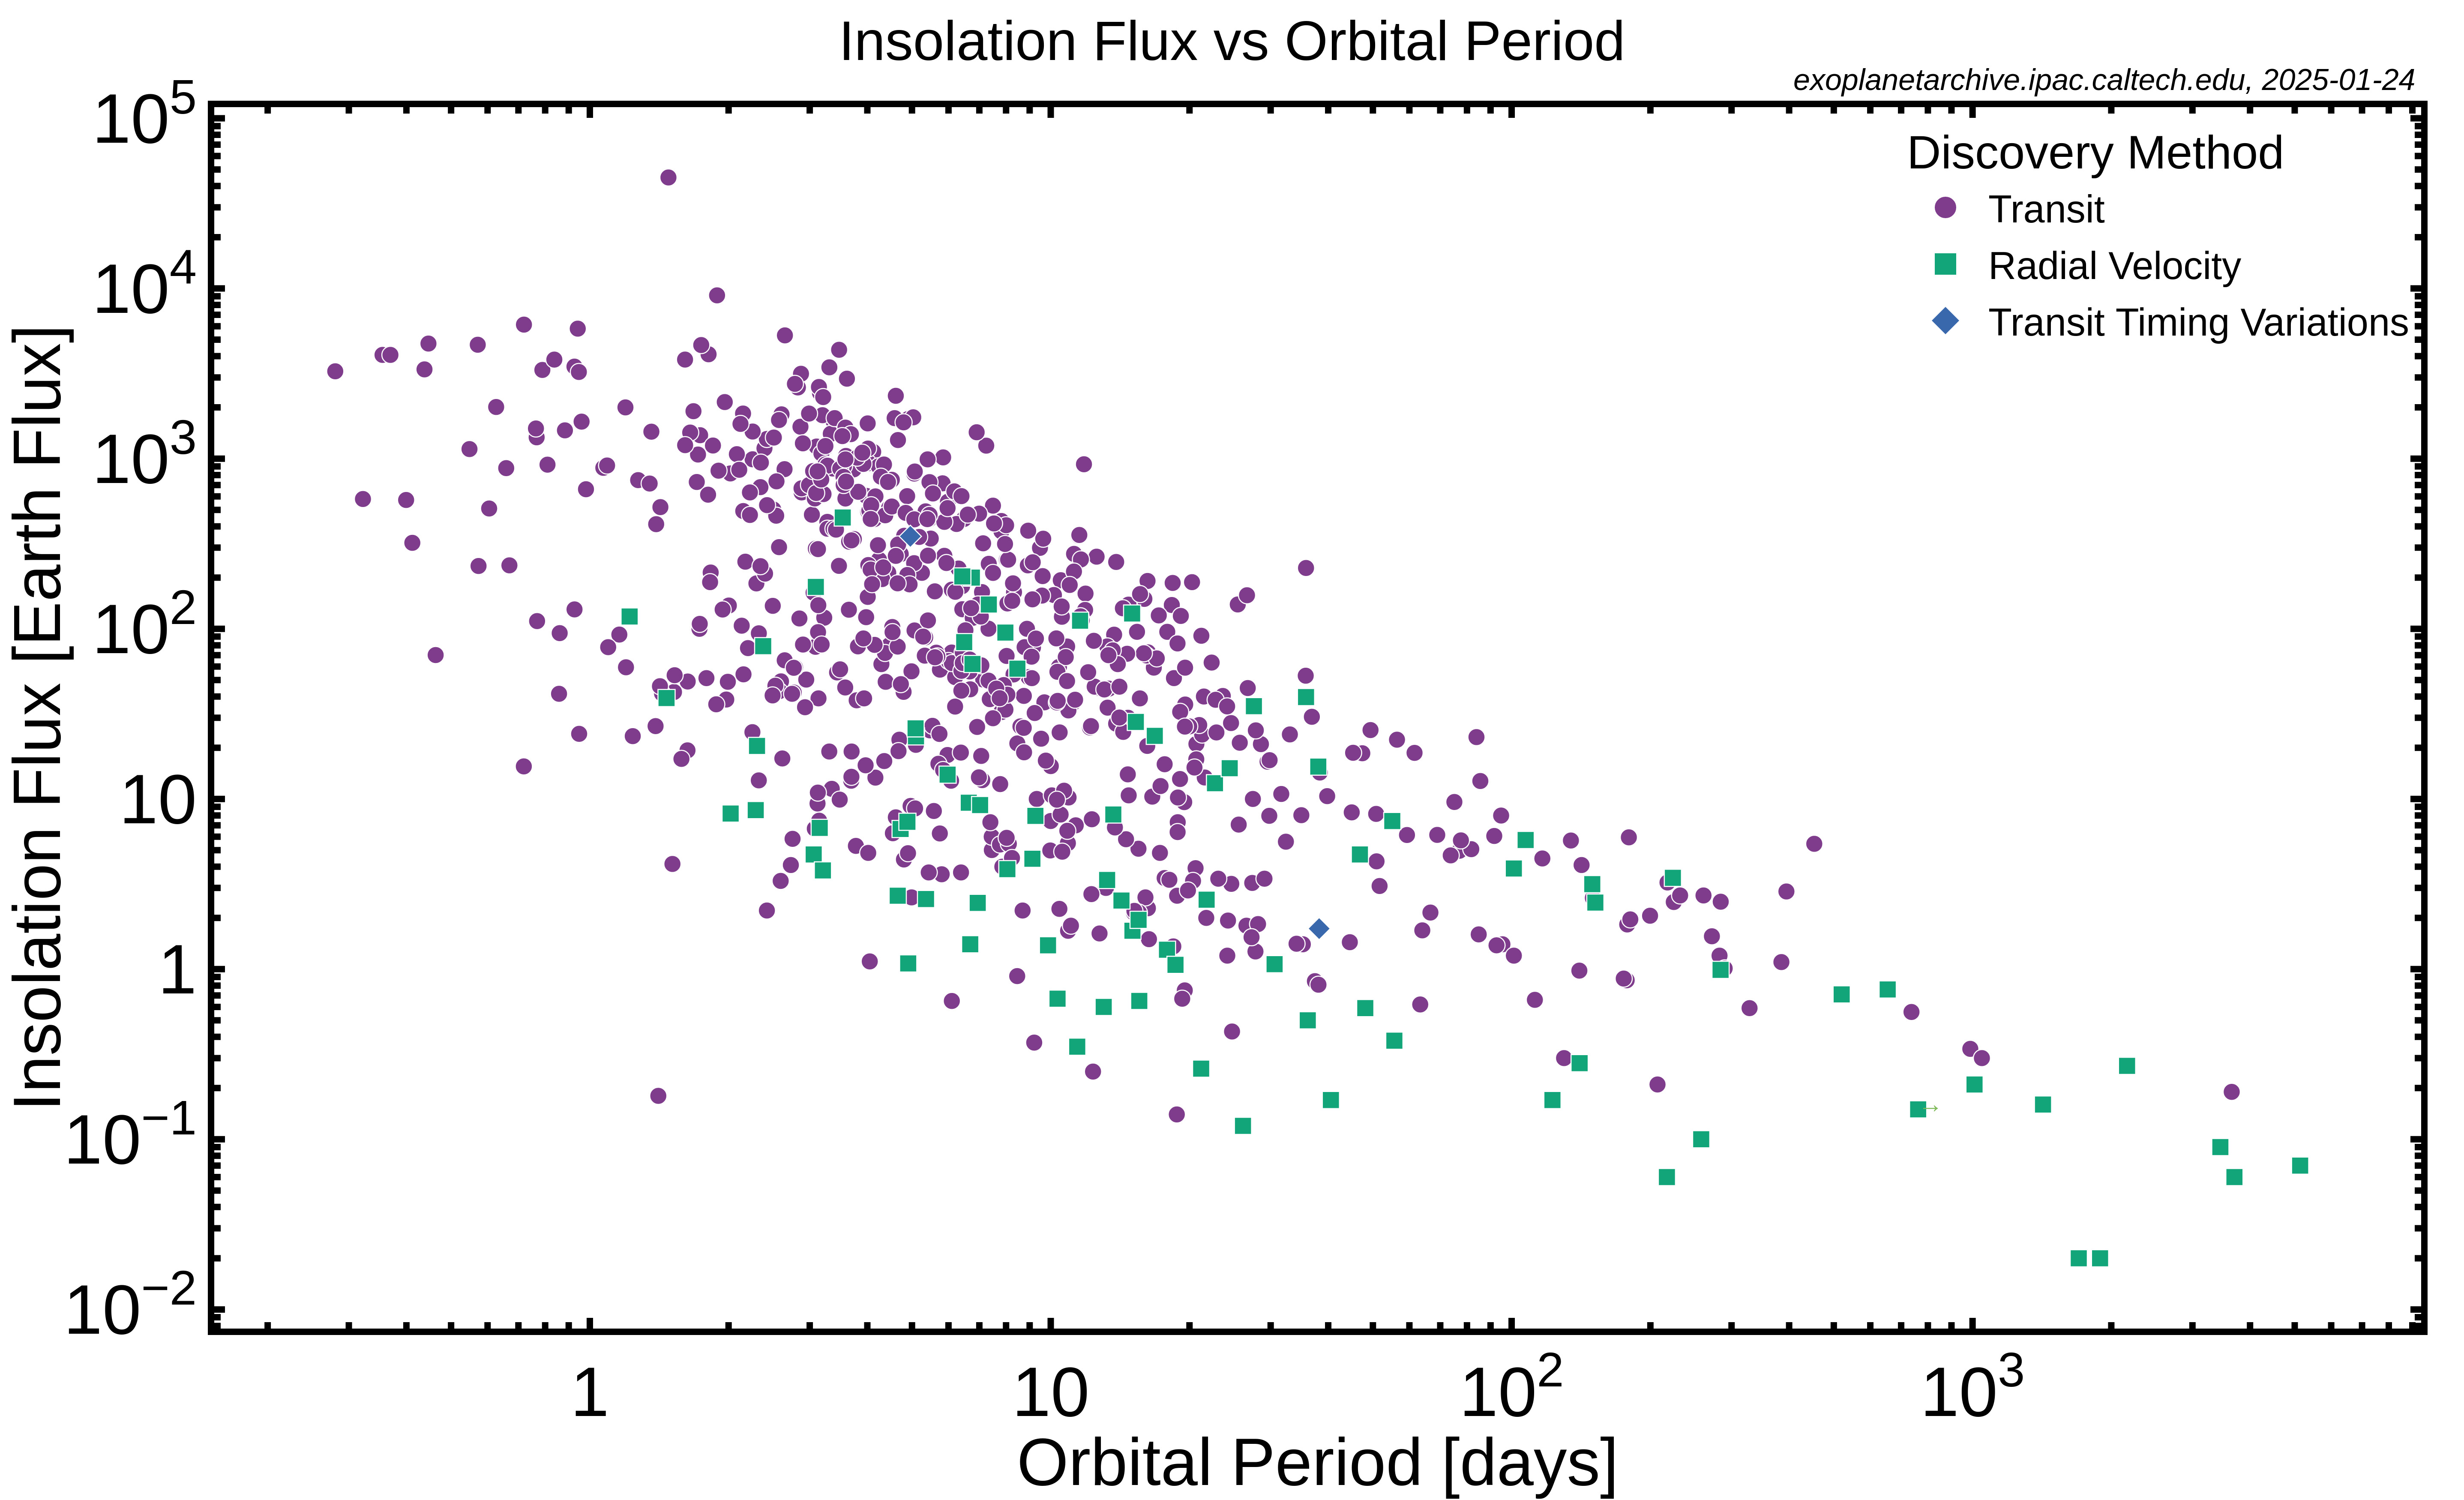
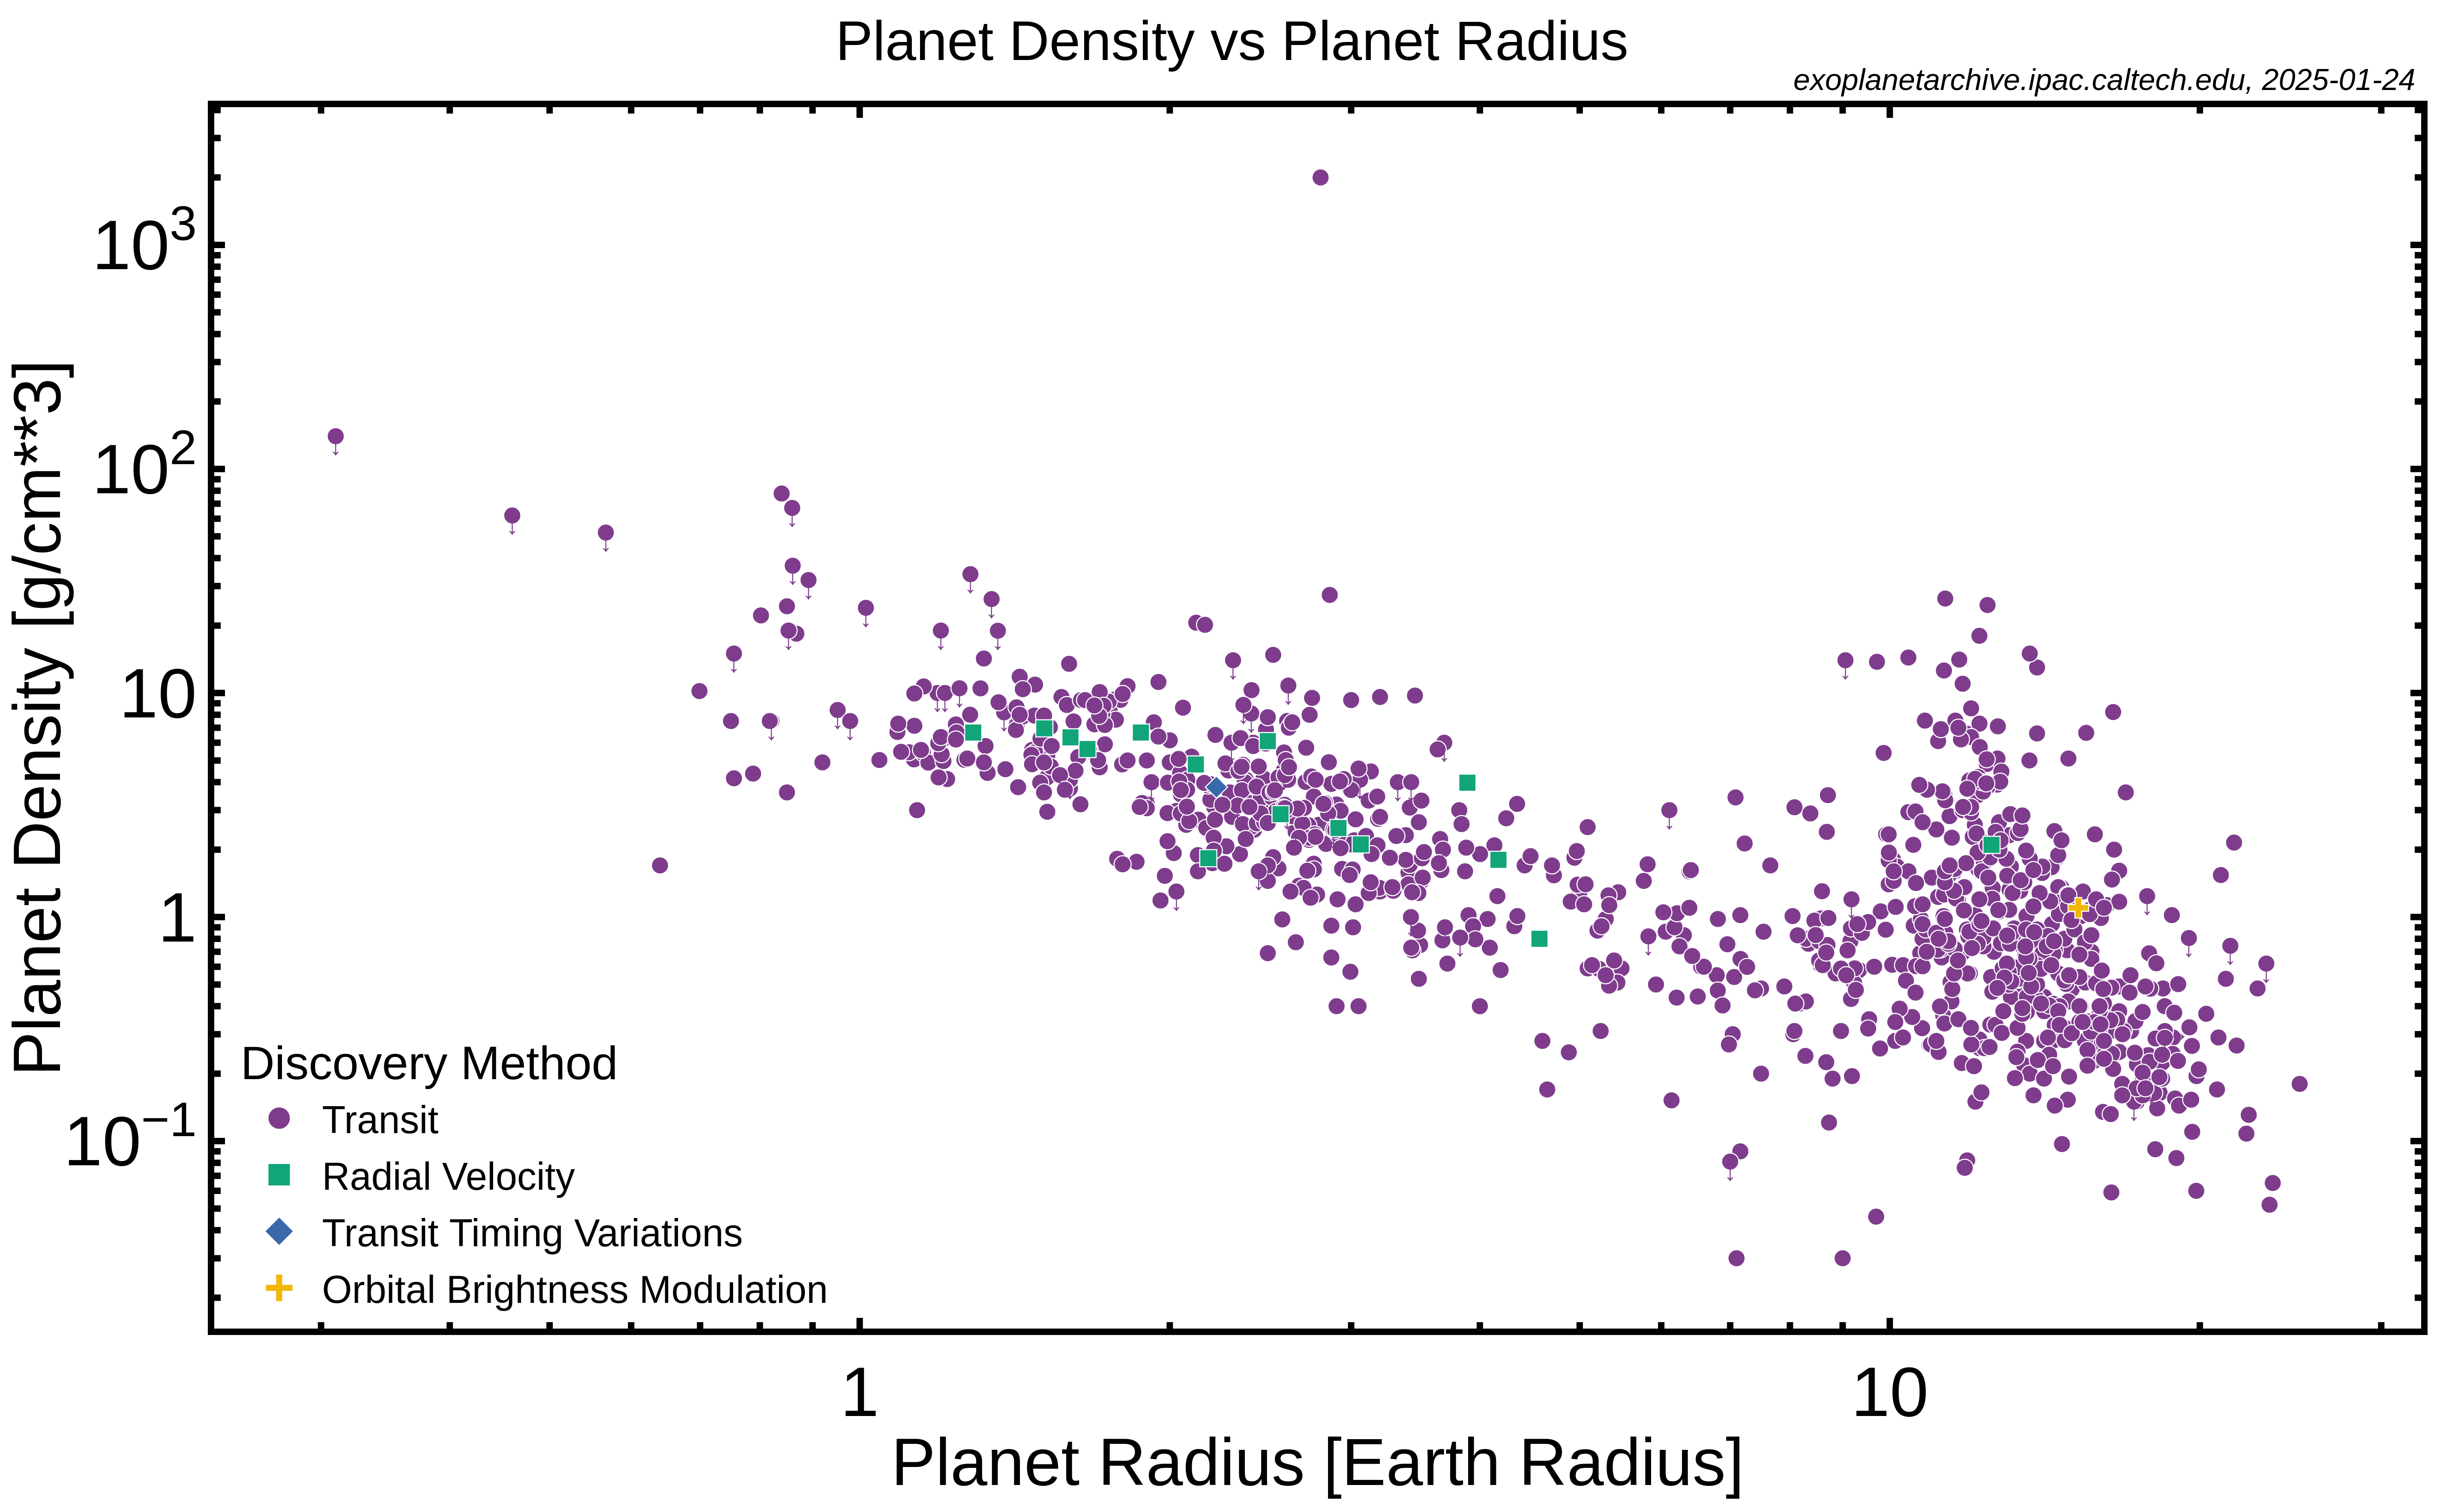
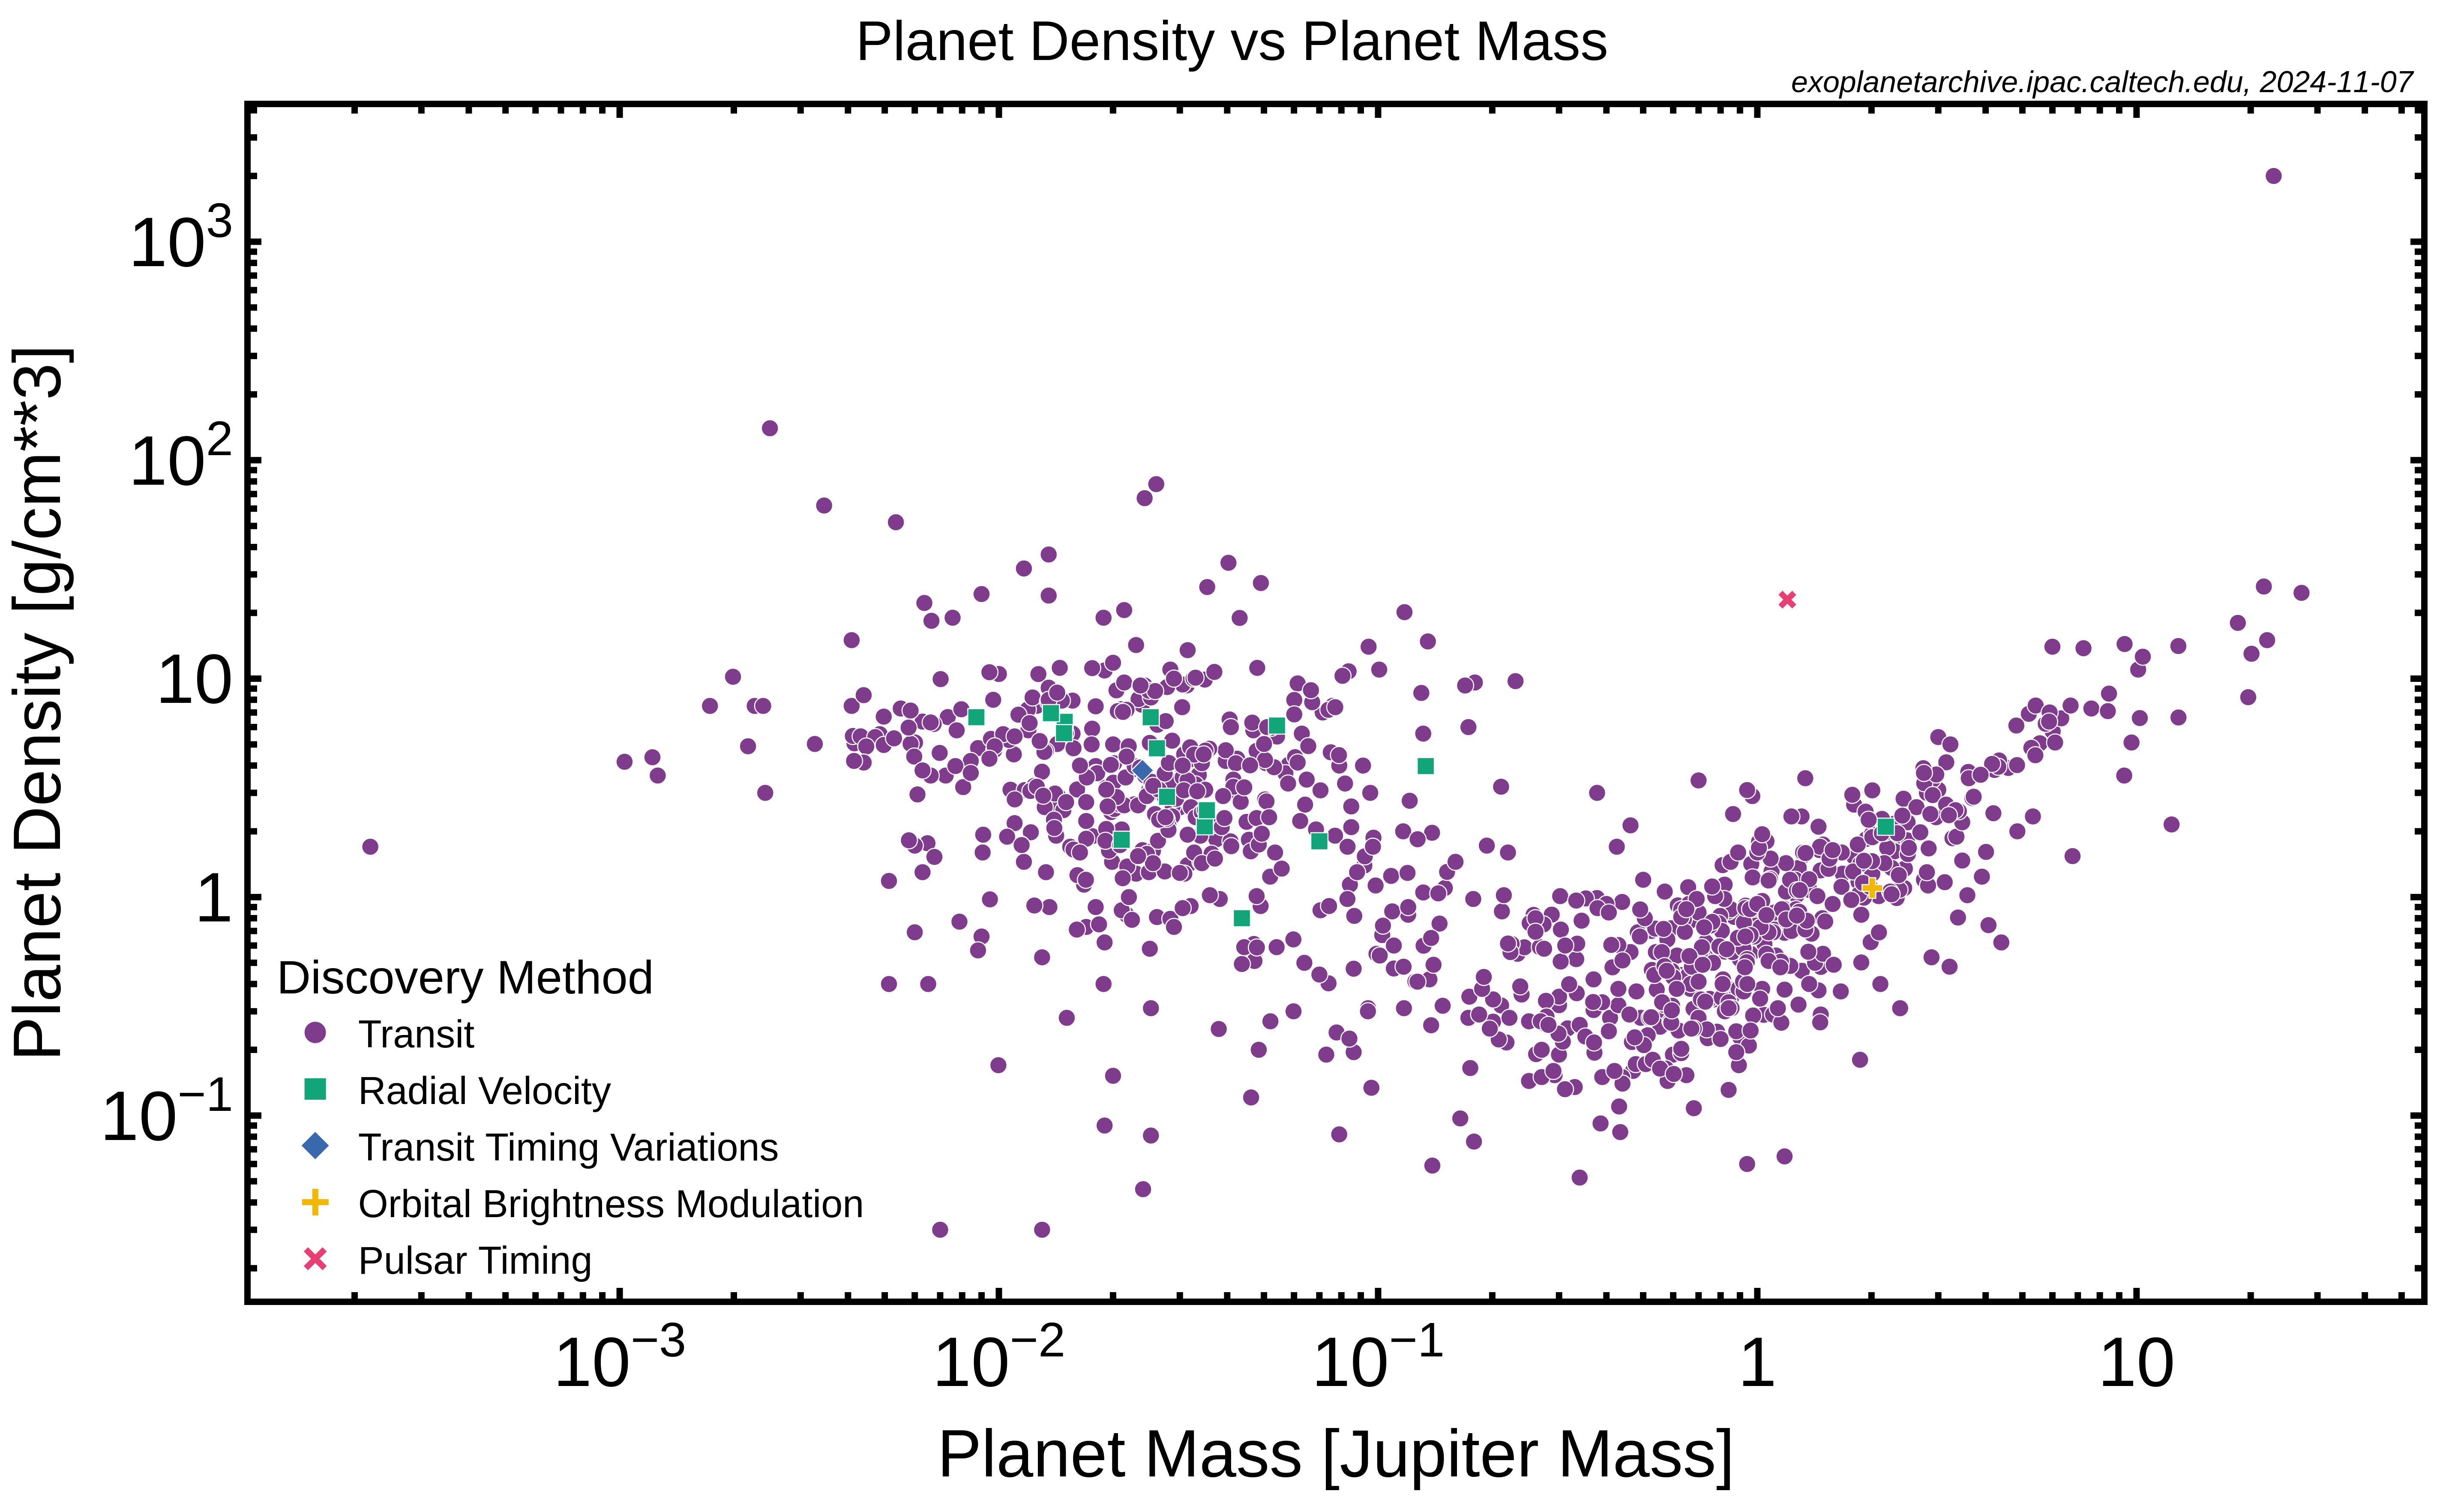
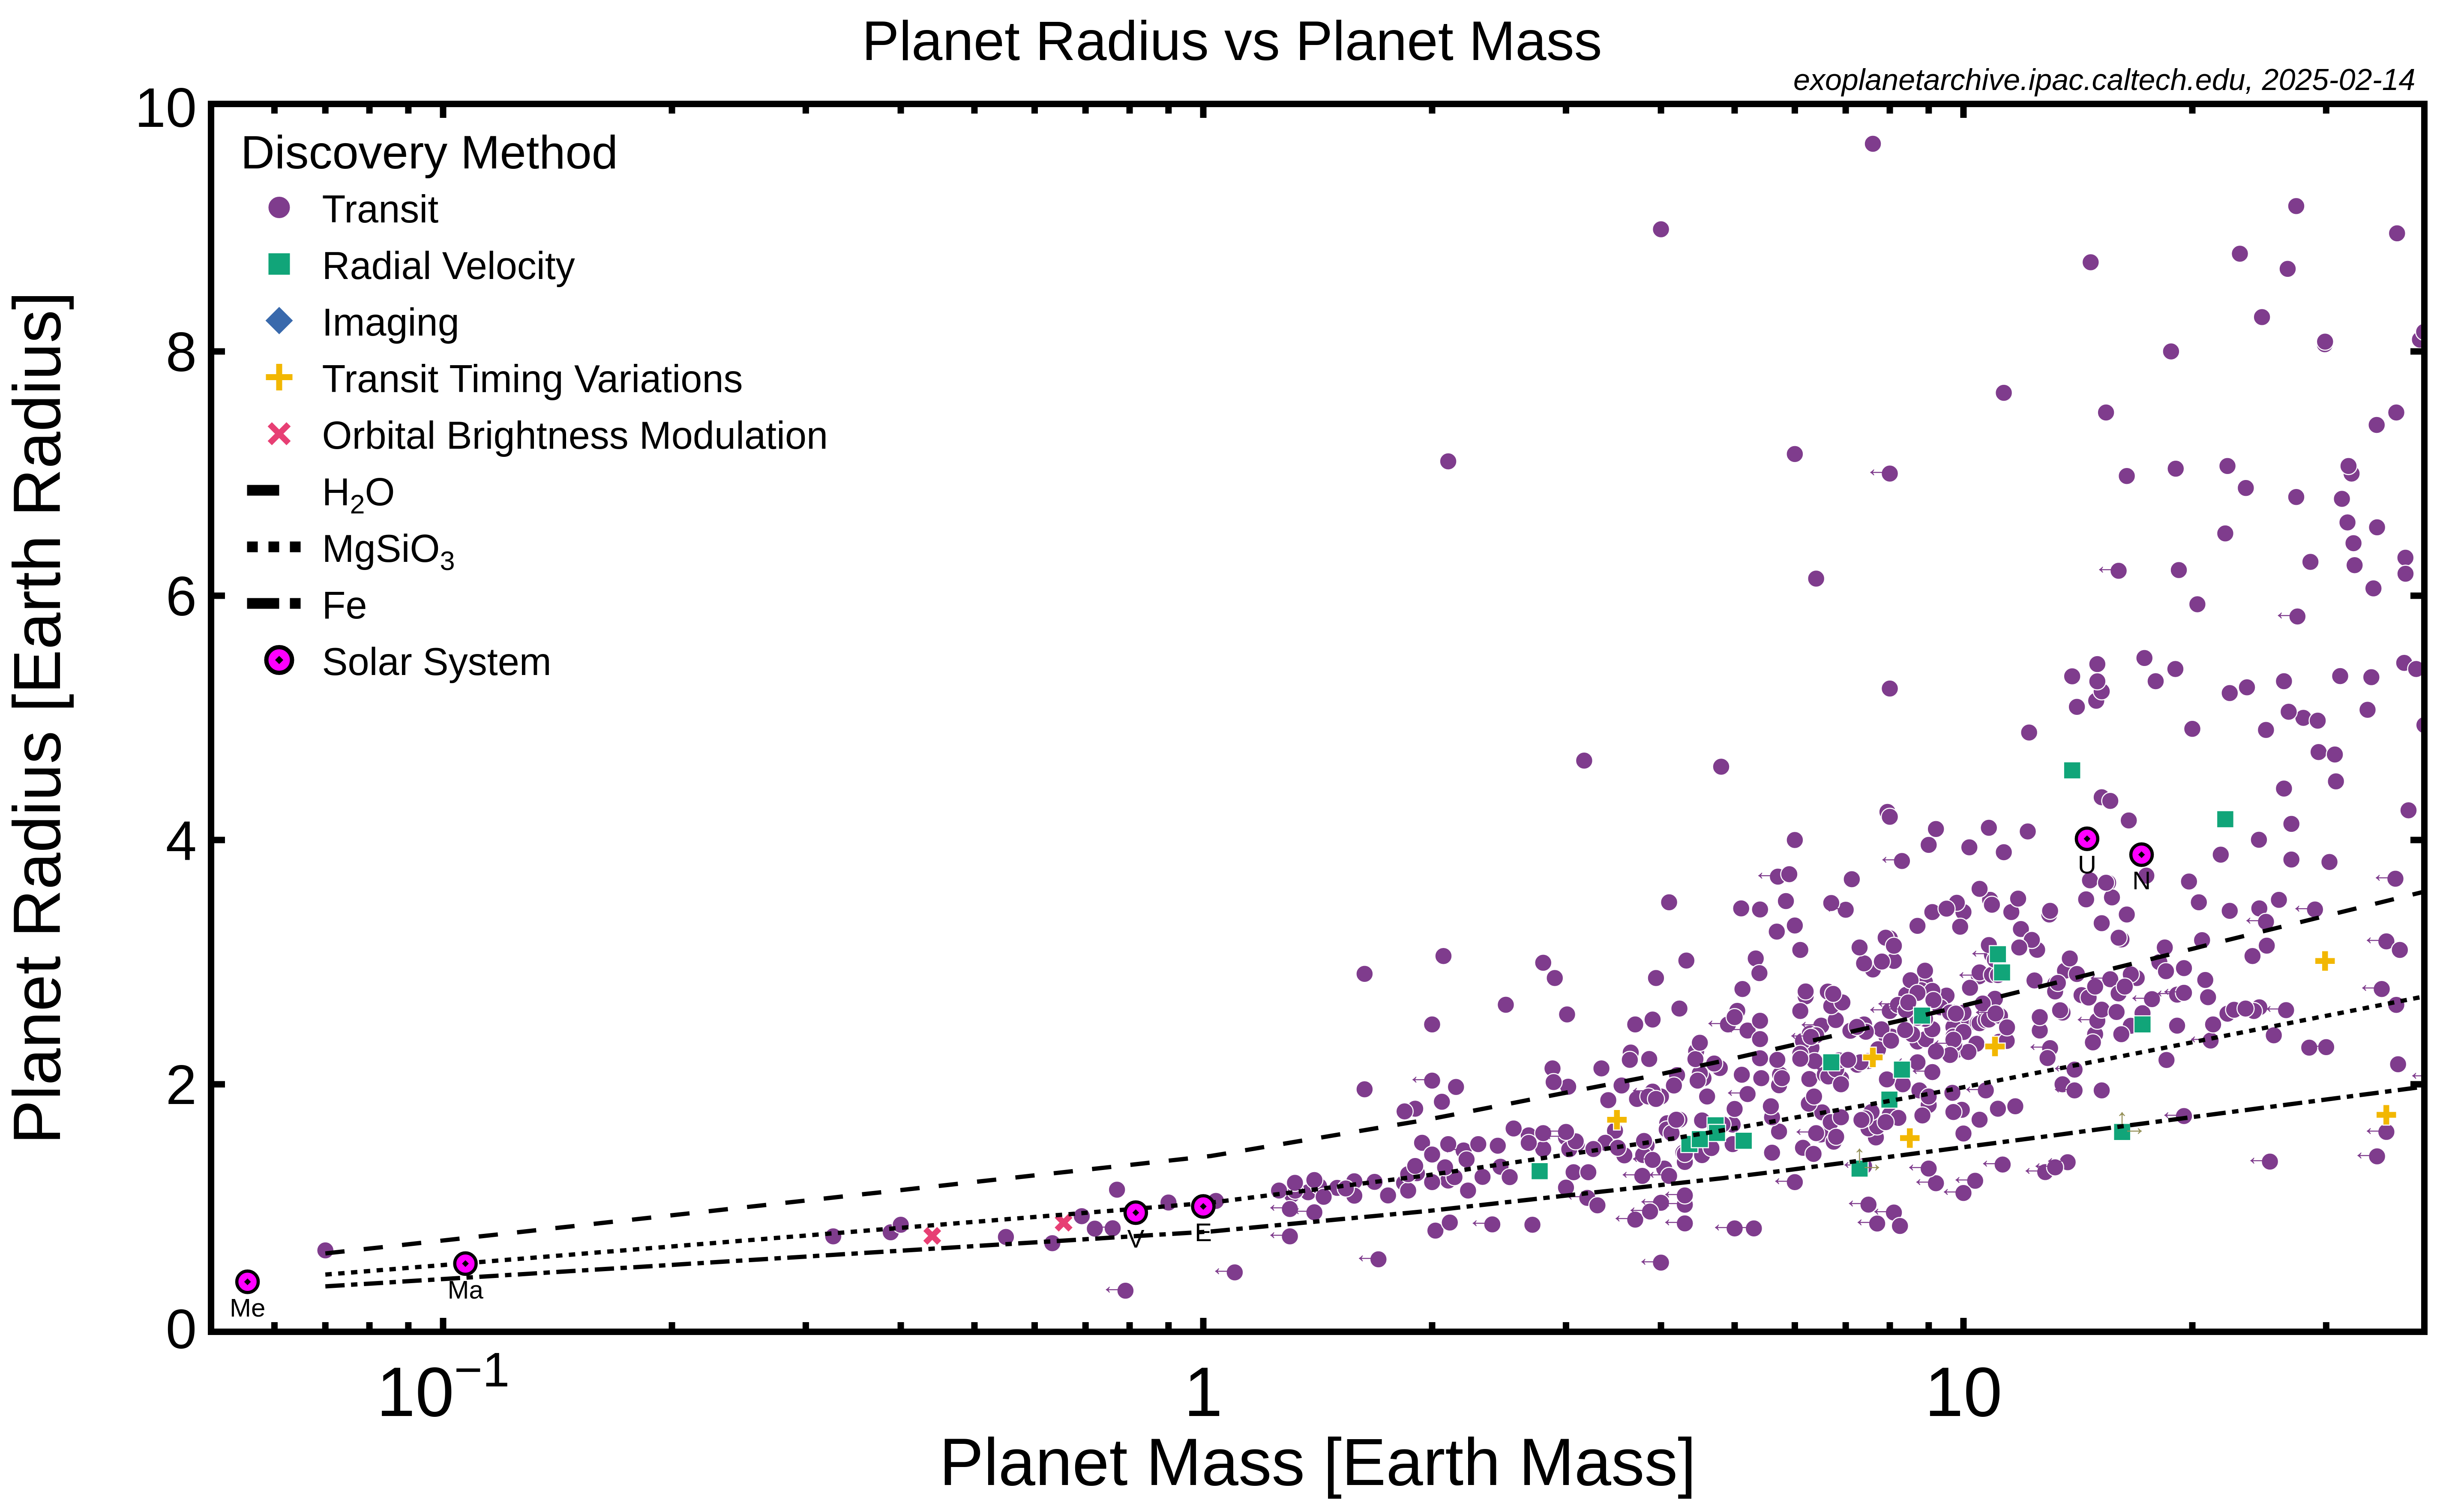
Confirmed Planets
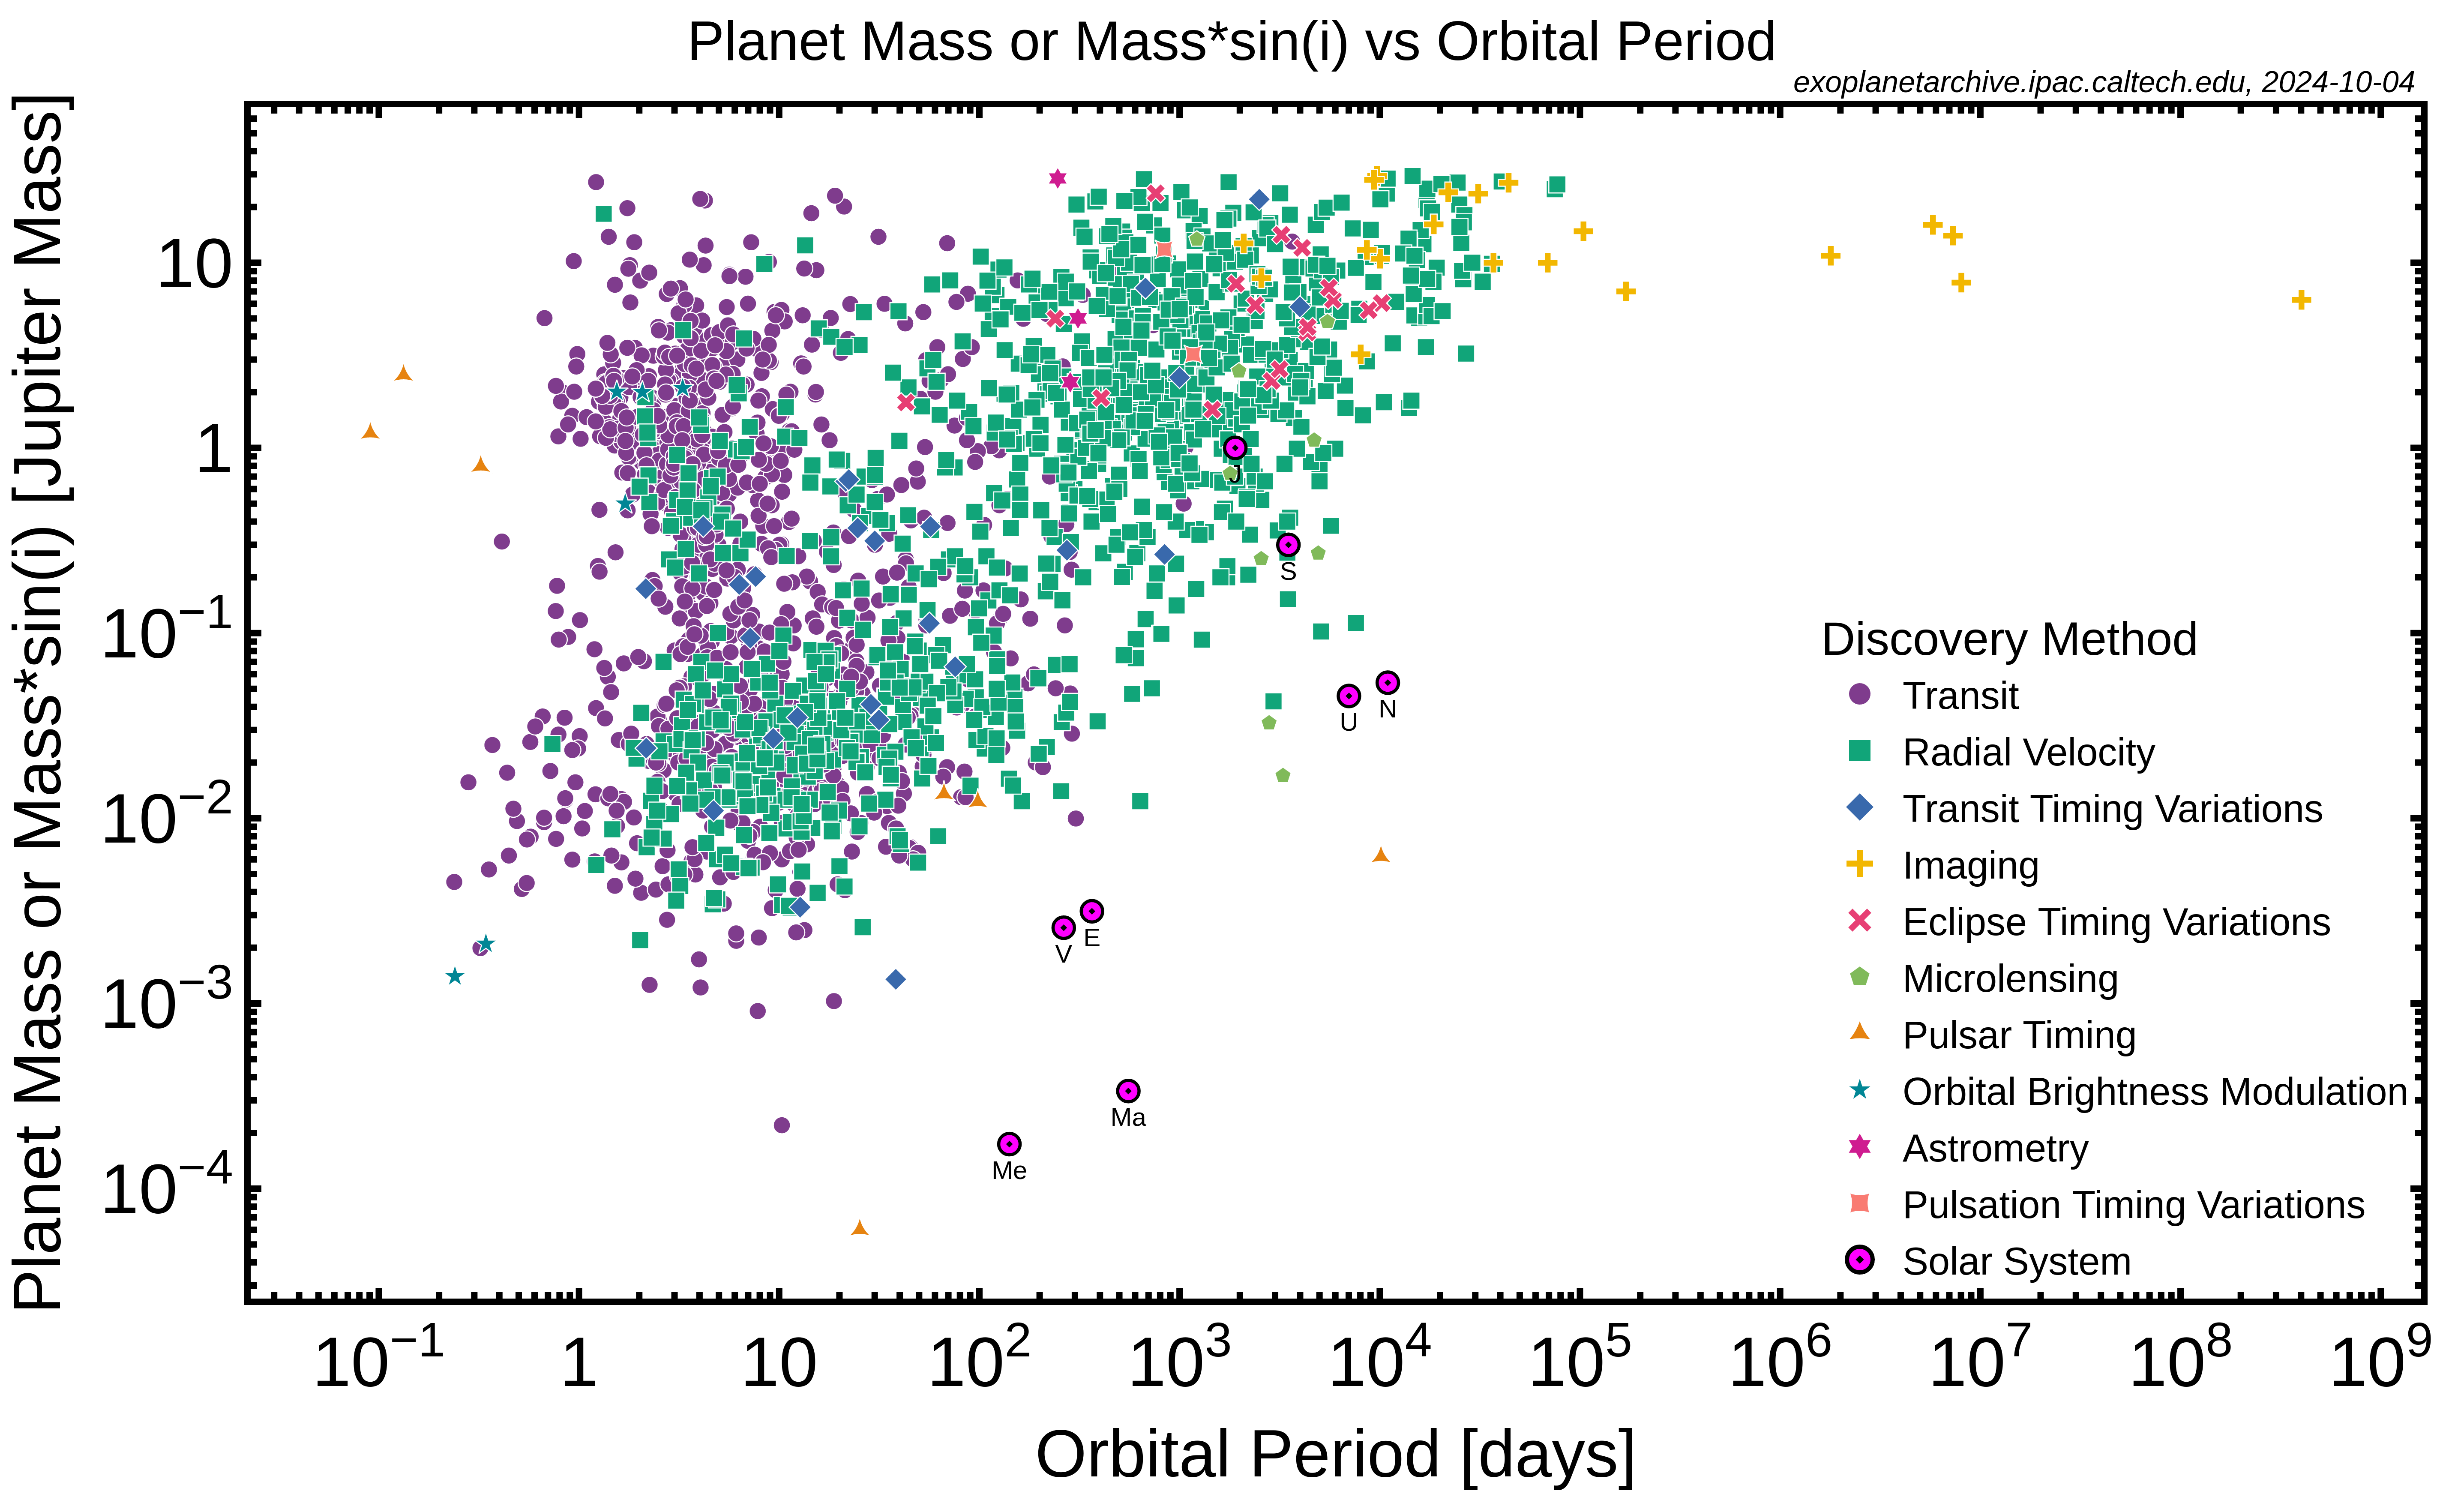
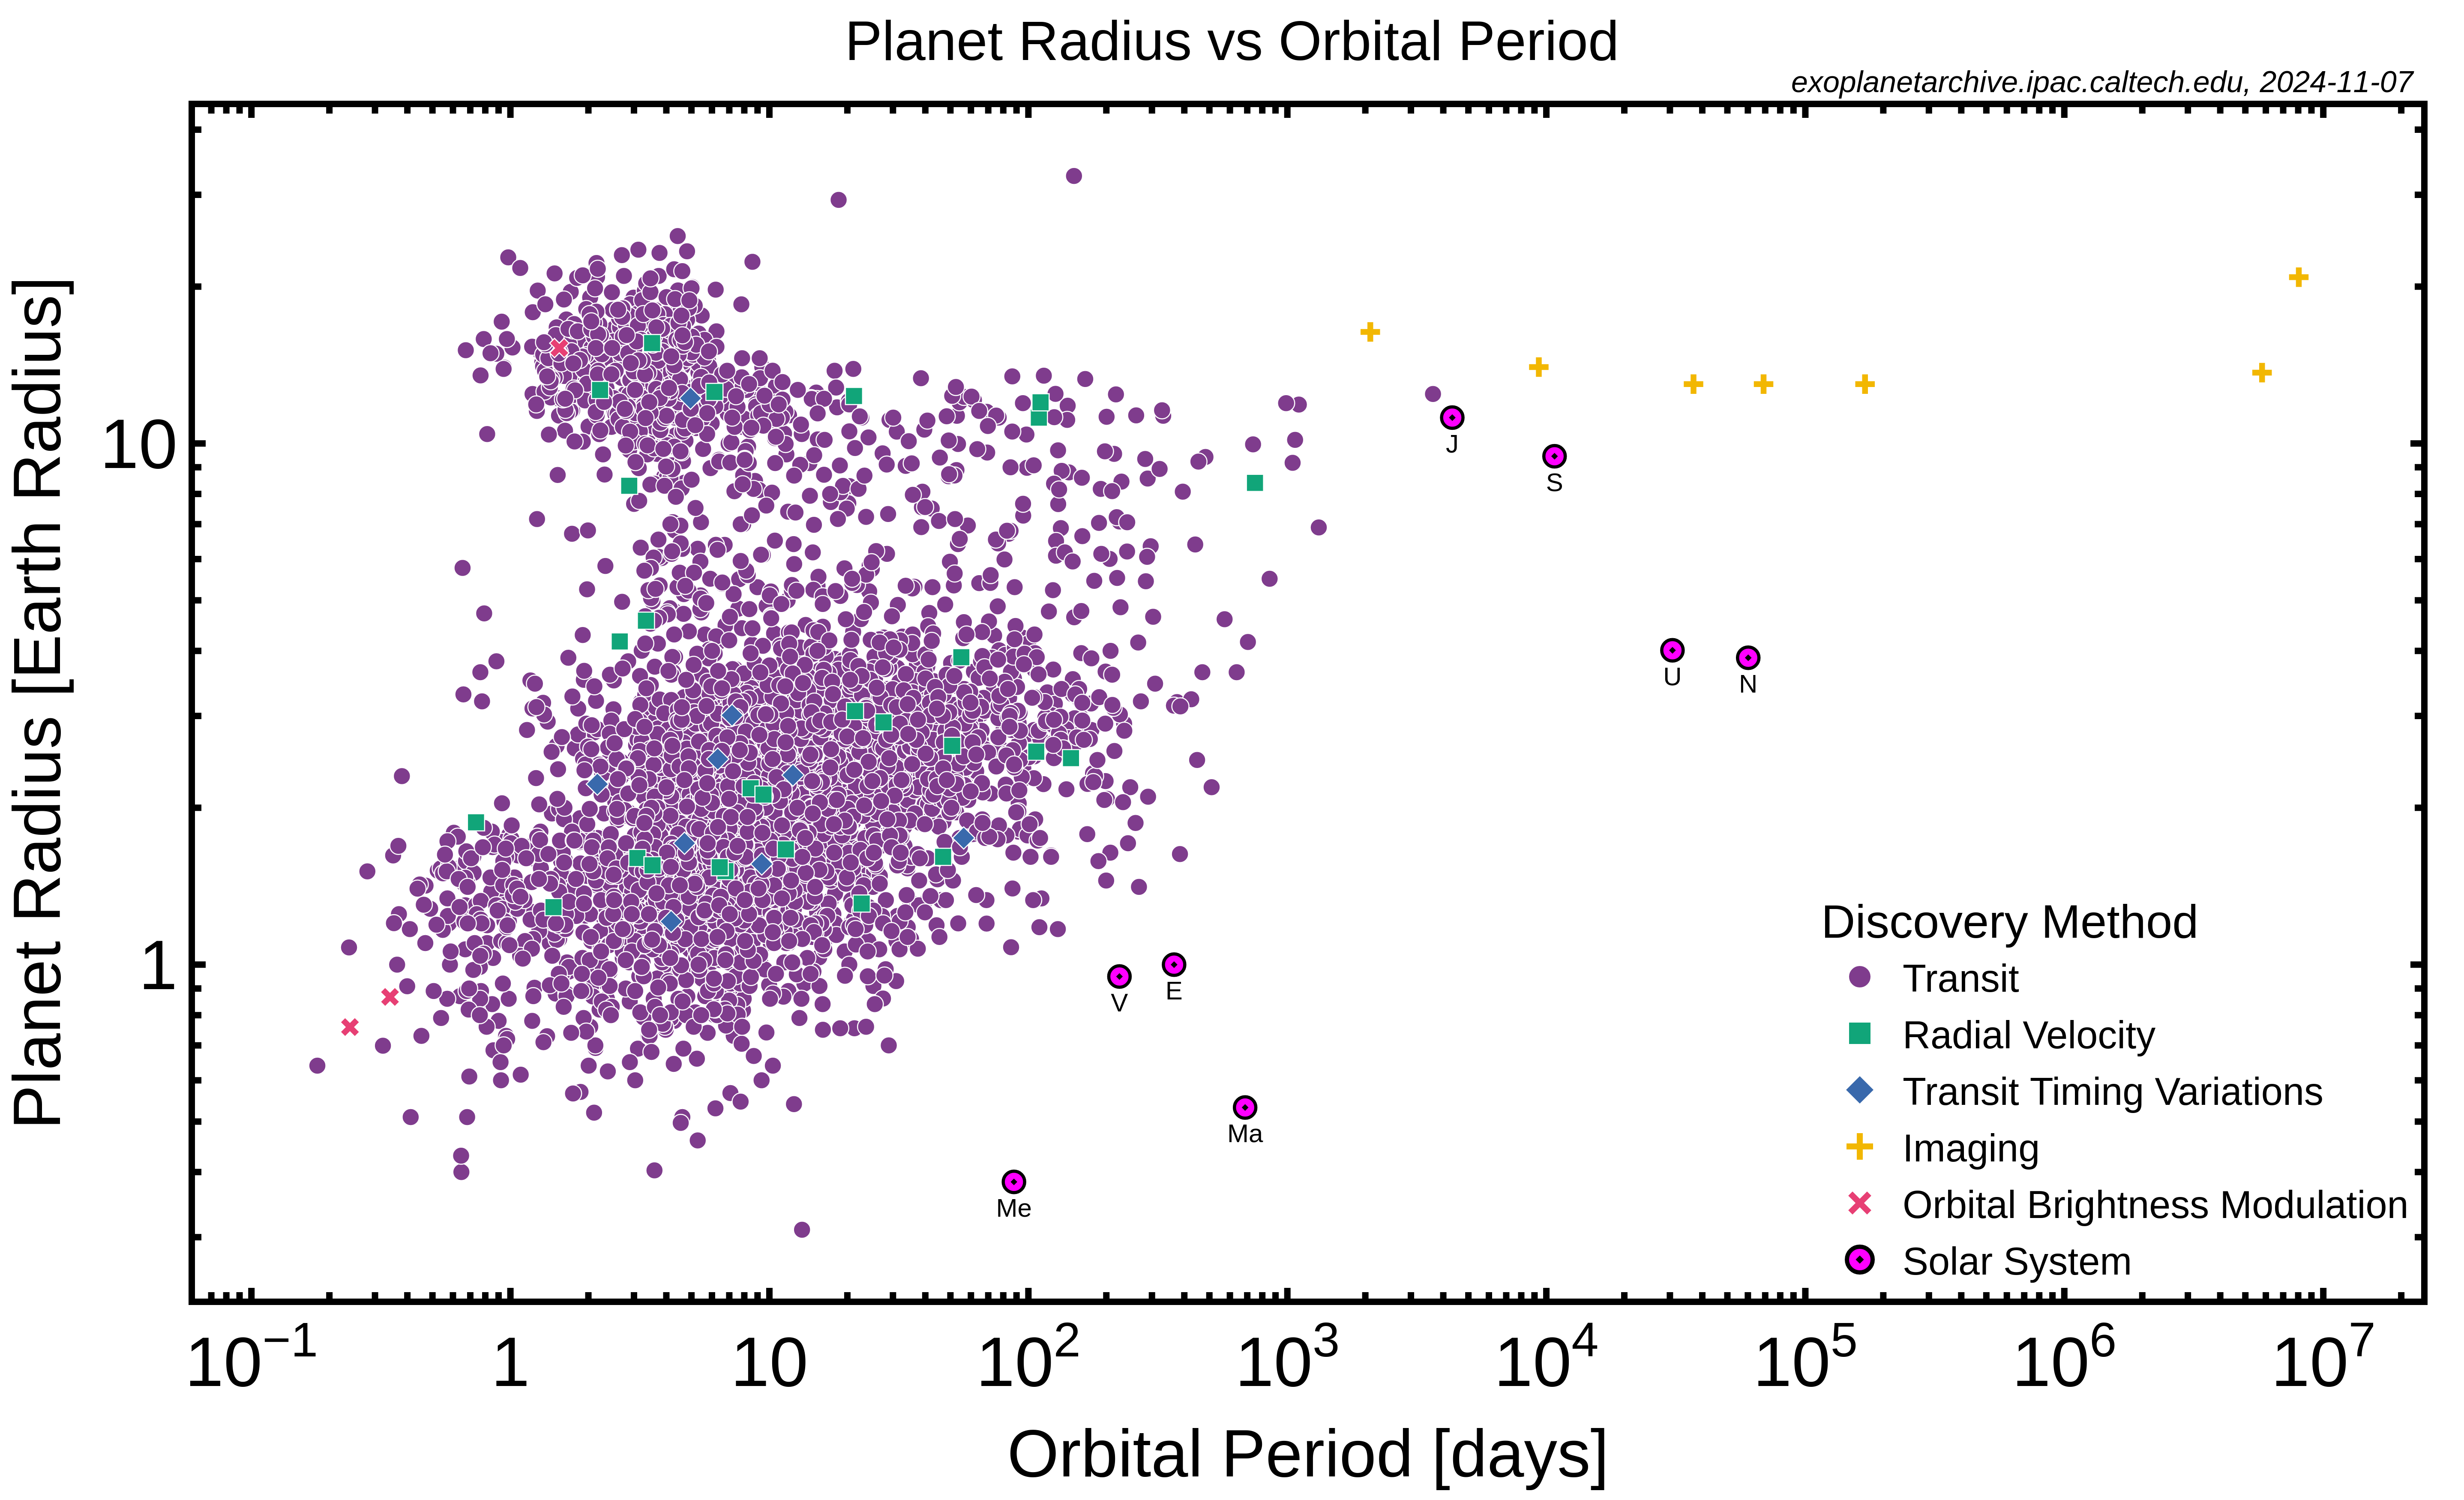
The values plotted are those listed in the Planetary Systems interactive table default parameter sets. In these plots, planets are grouped by discovery method. The radius vs. mass plot has been zoomed in to display planet masses in the range 0.05 to 40 Earth masses and planet radii between 0 and 10 Earth radii, with the addition of H2O, MgSiO3 and Fe density curves for reference (see Table 4 of Seager et al. 2007). That plot, together with the radius vs. period and mass vs. period plots, also include data points for the solar system planets.
|
|
|
|
|
|
|
|
|

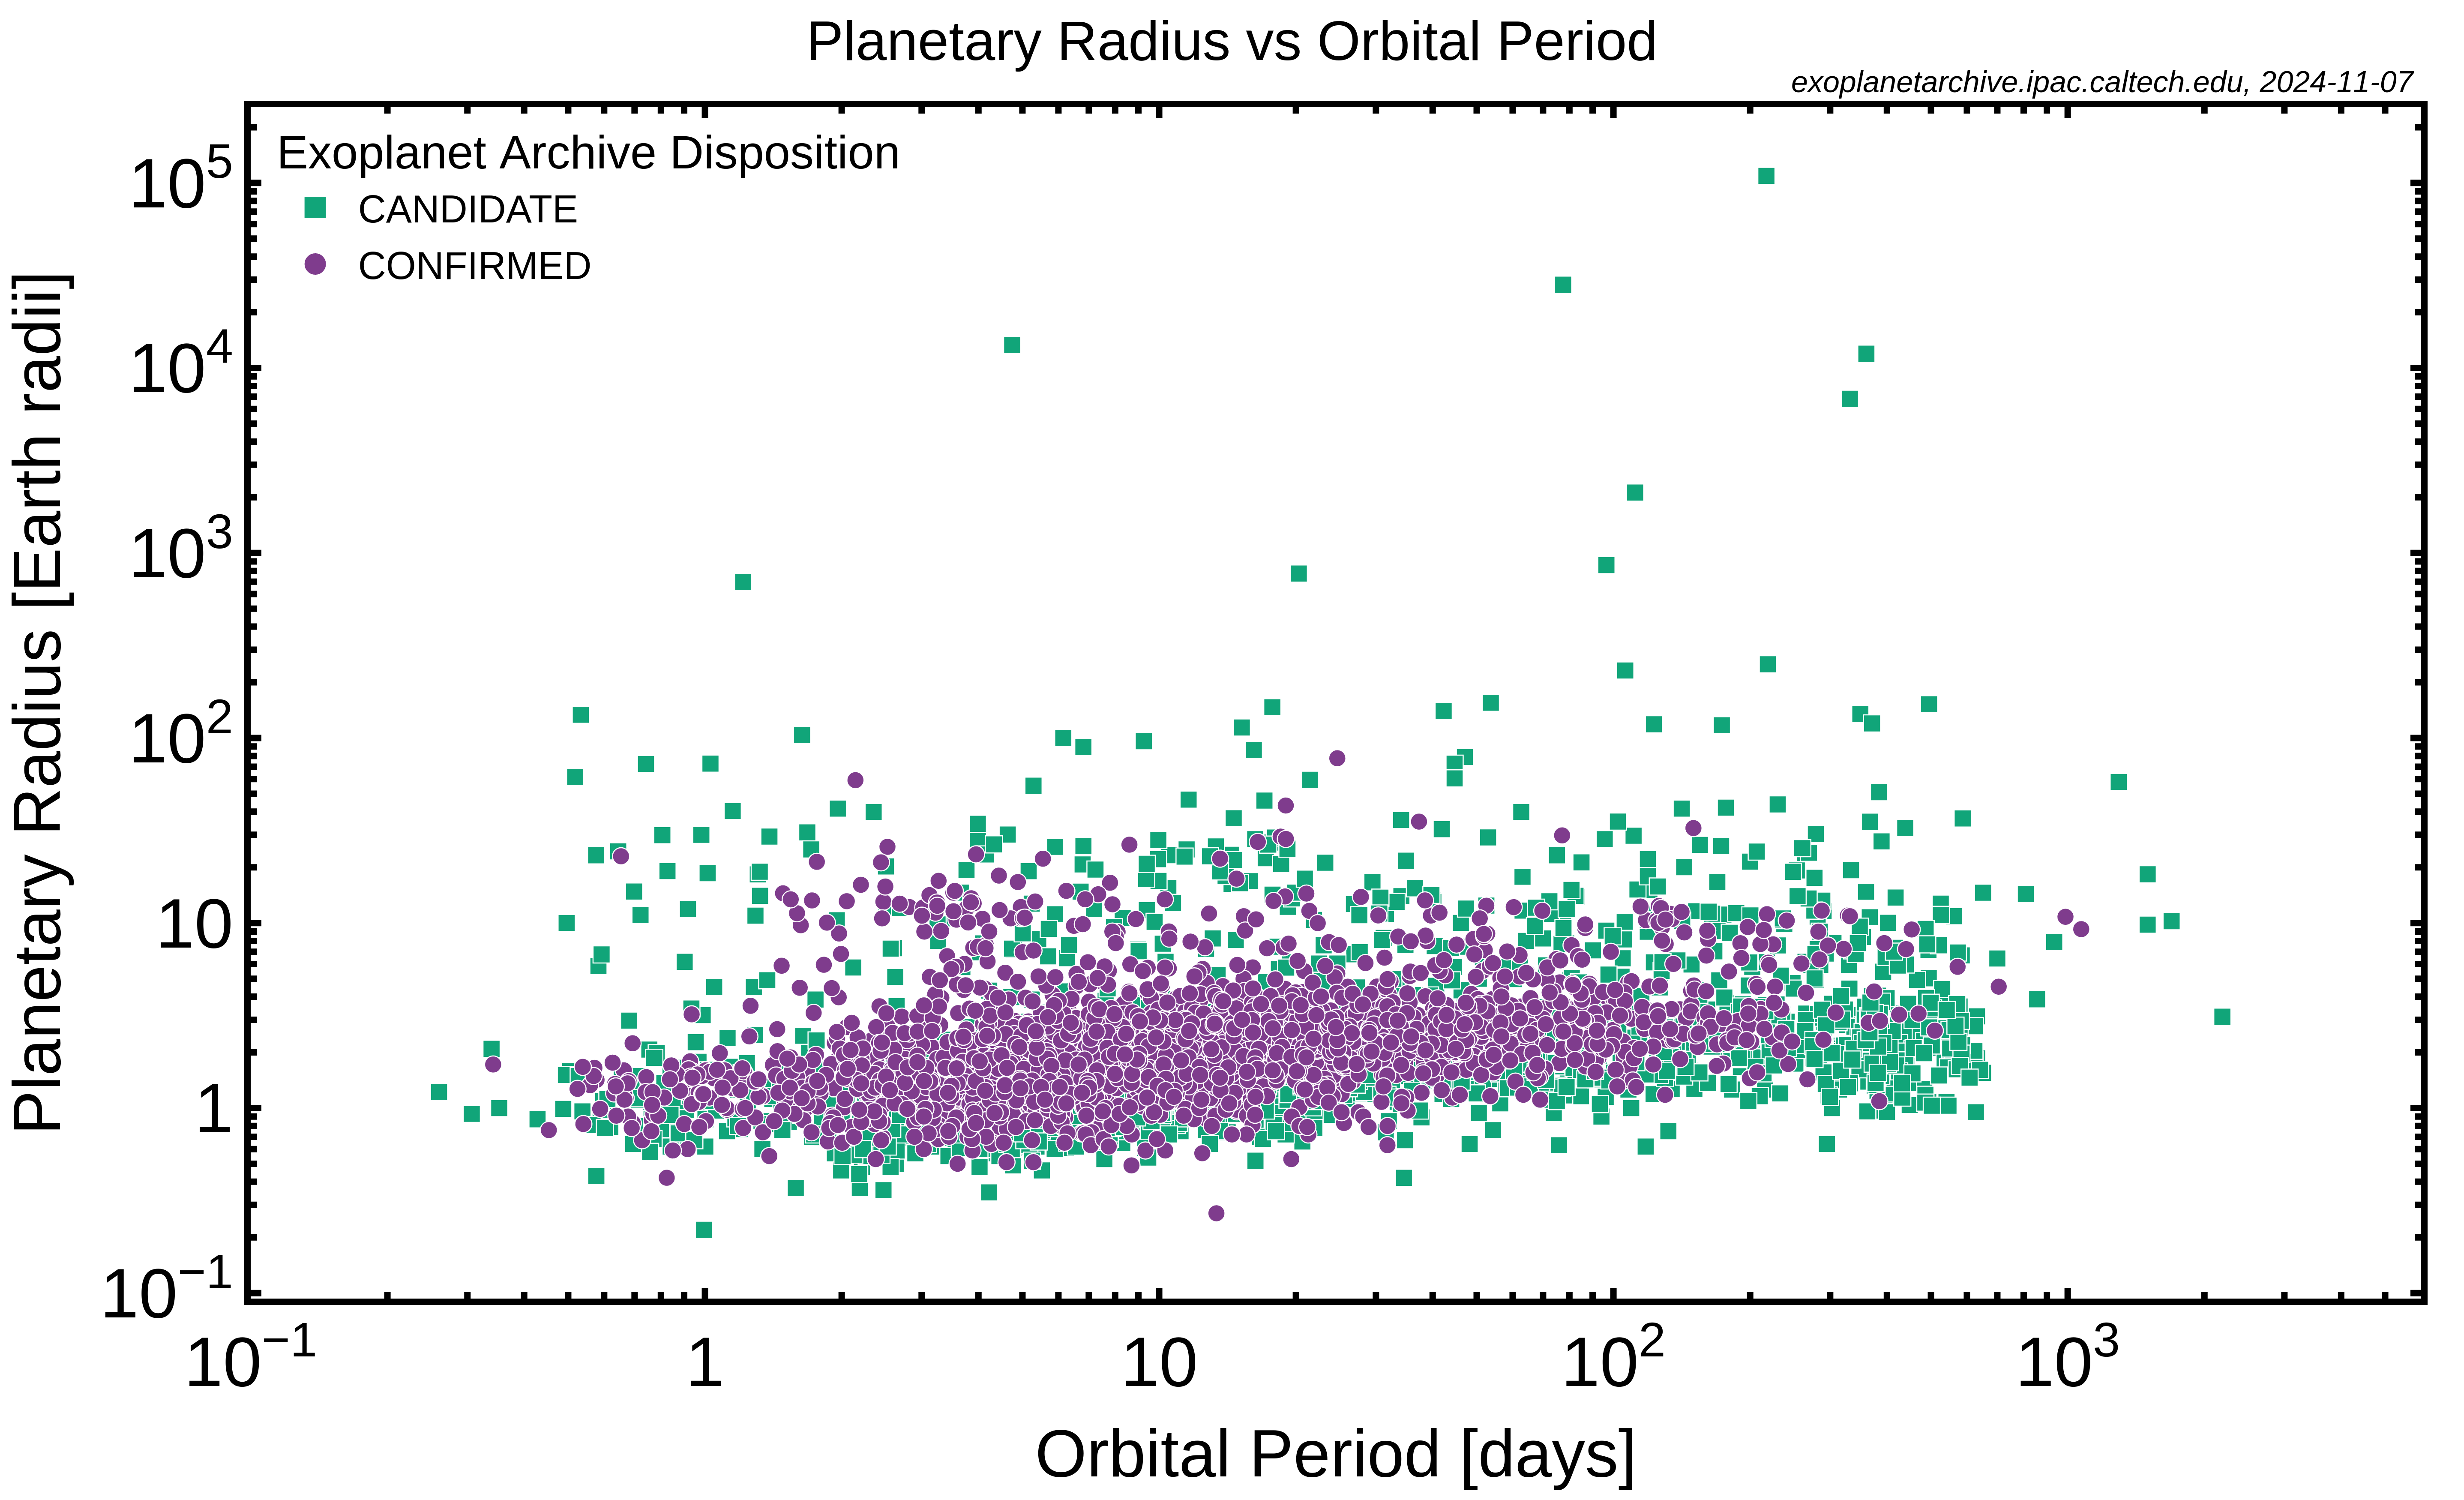
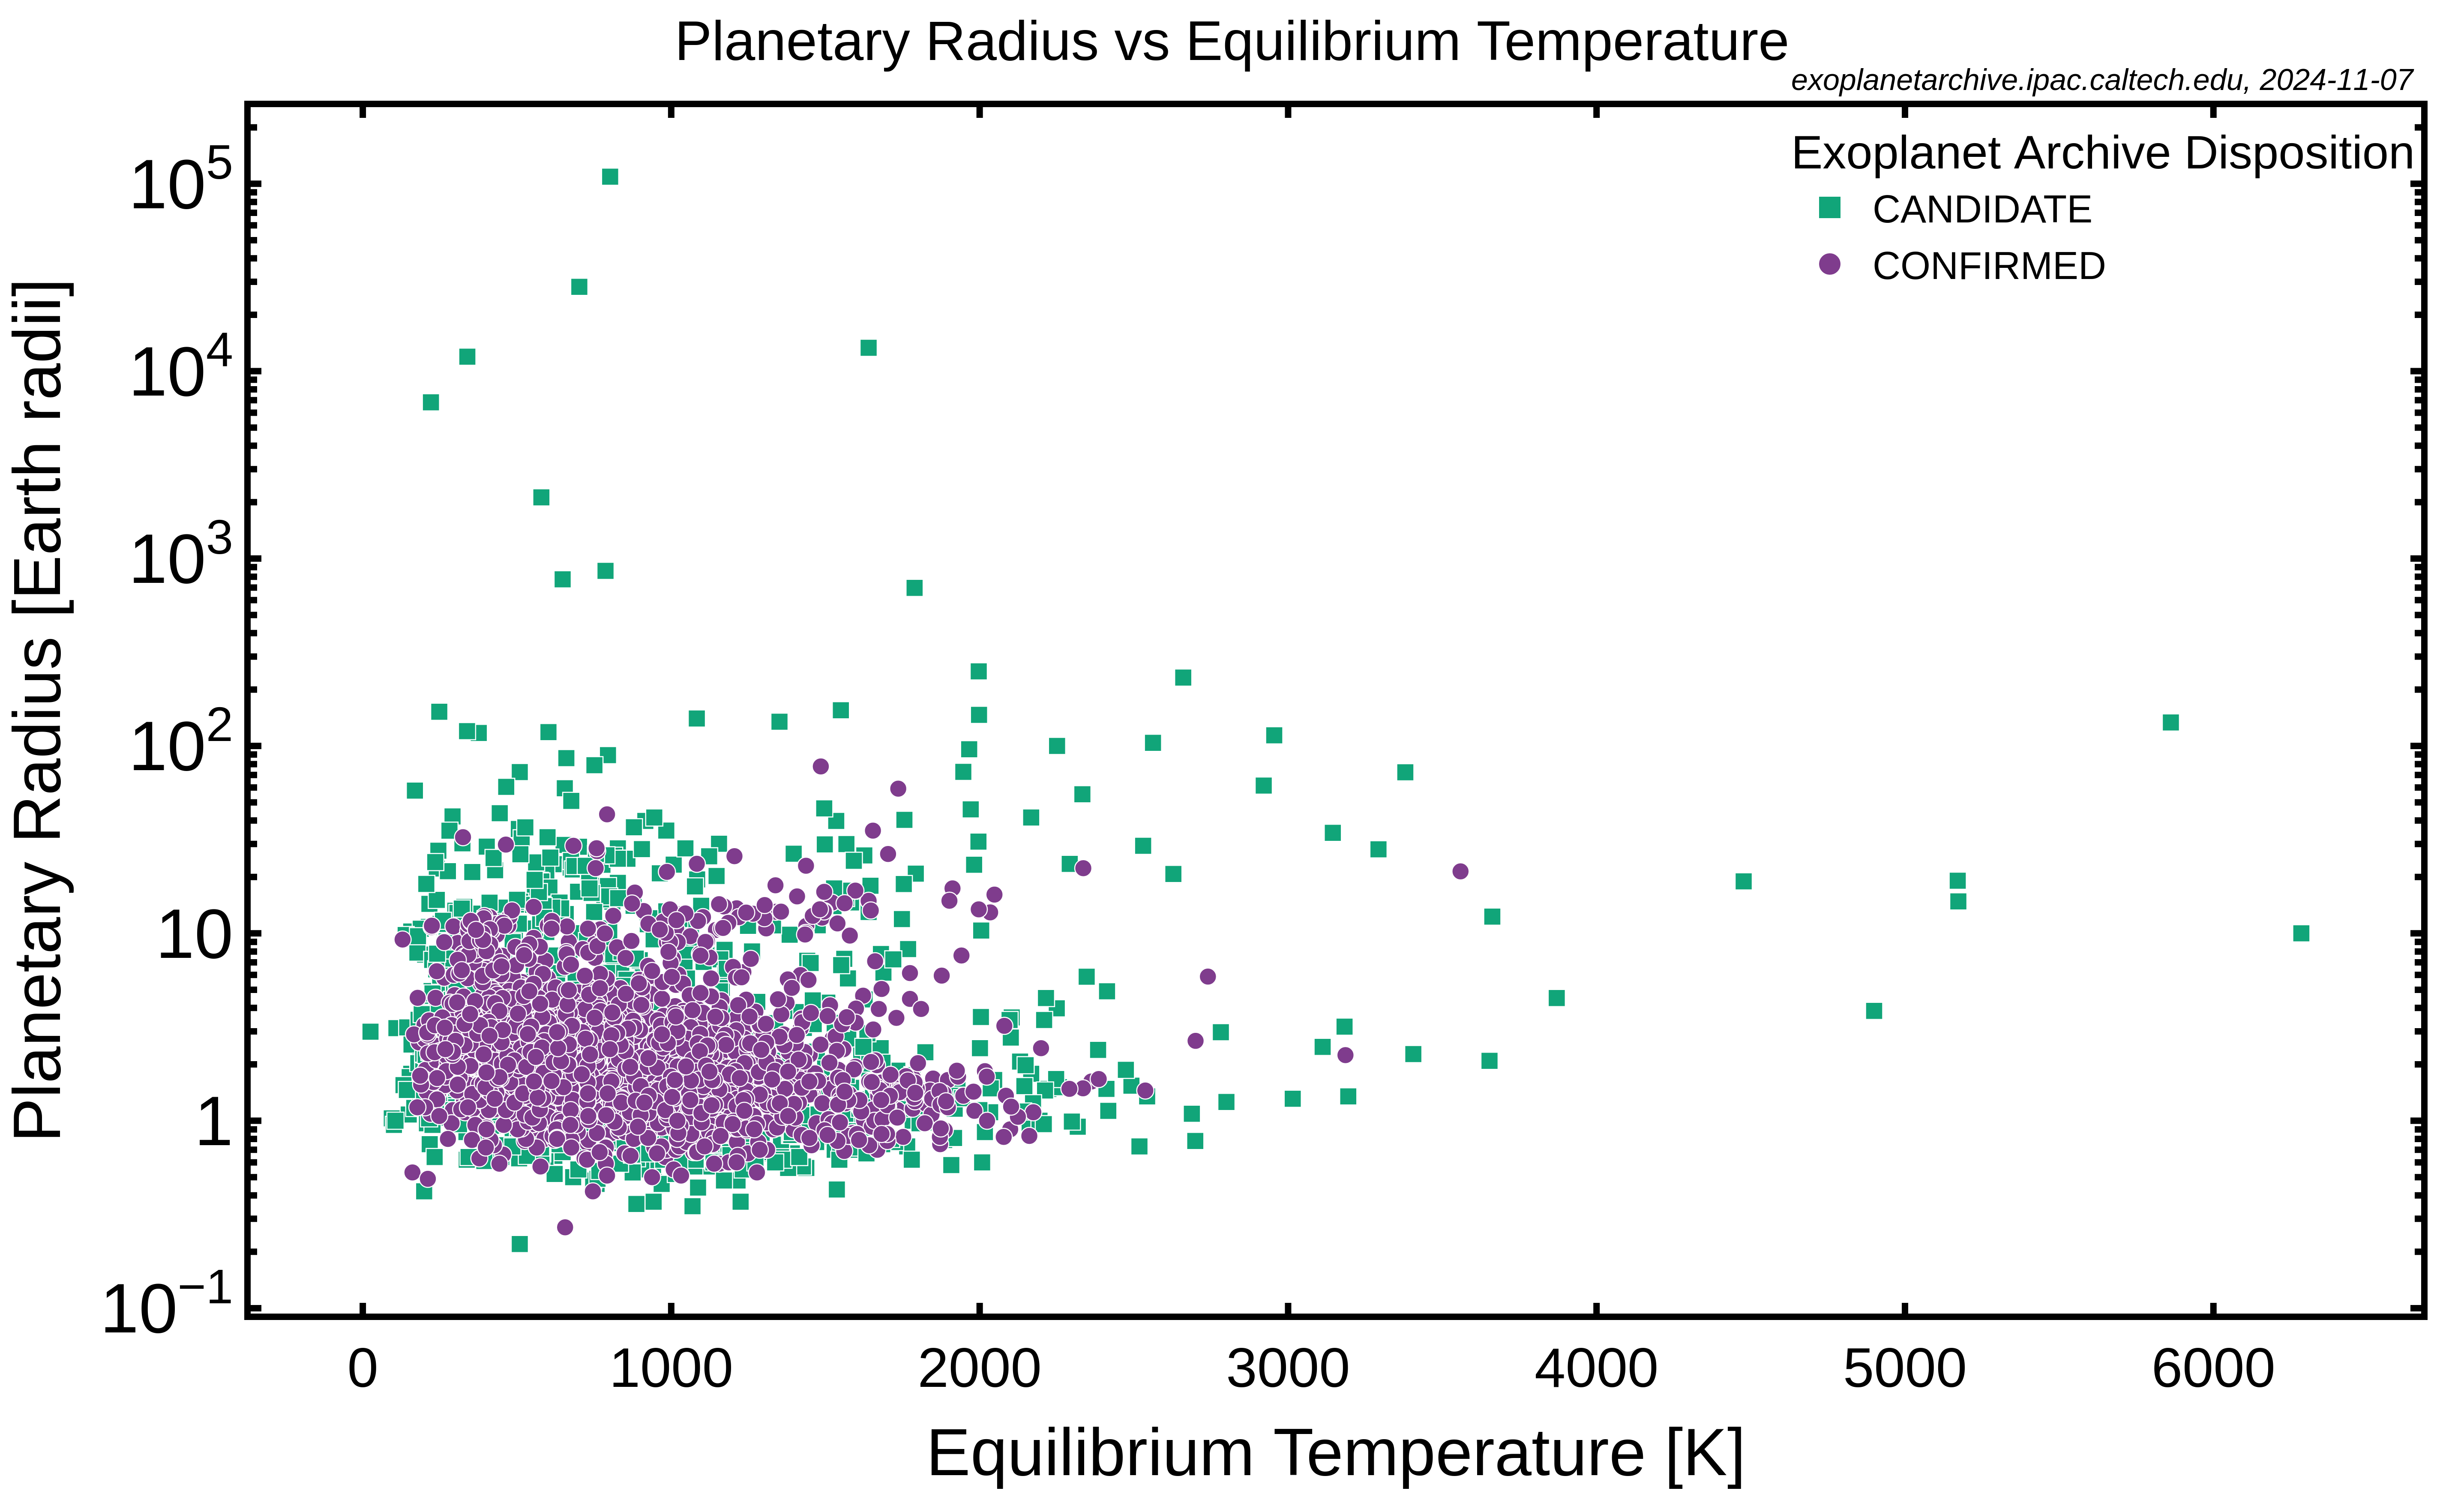
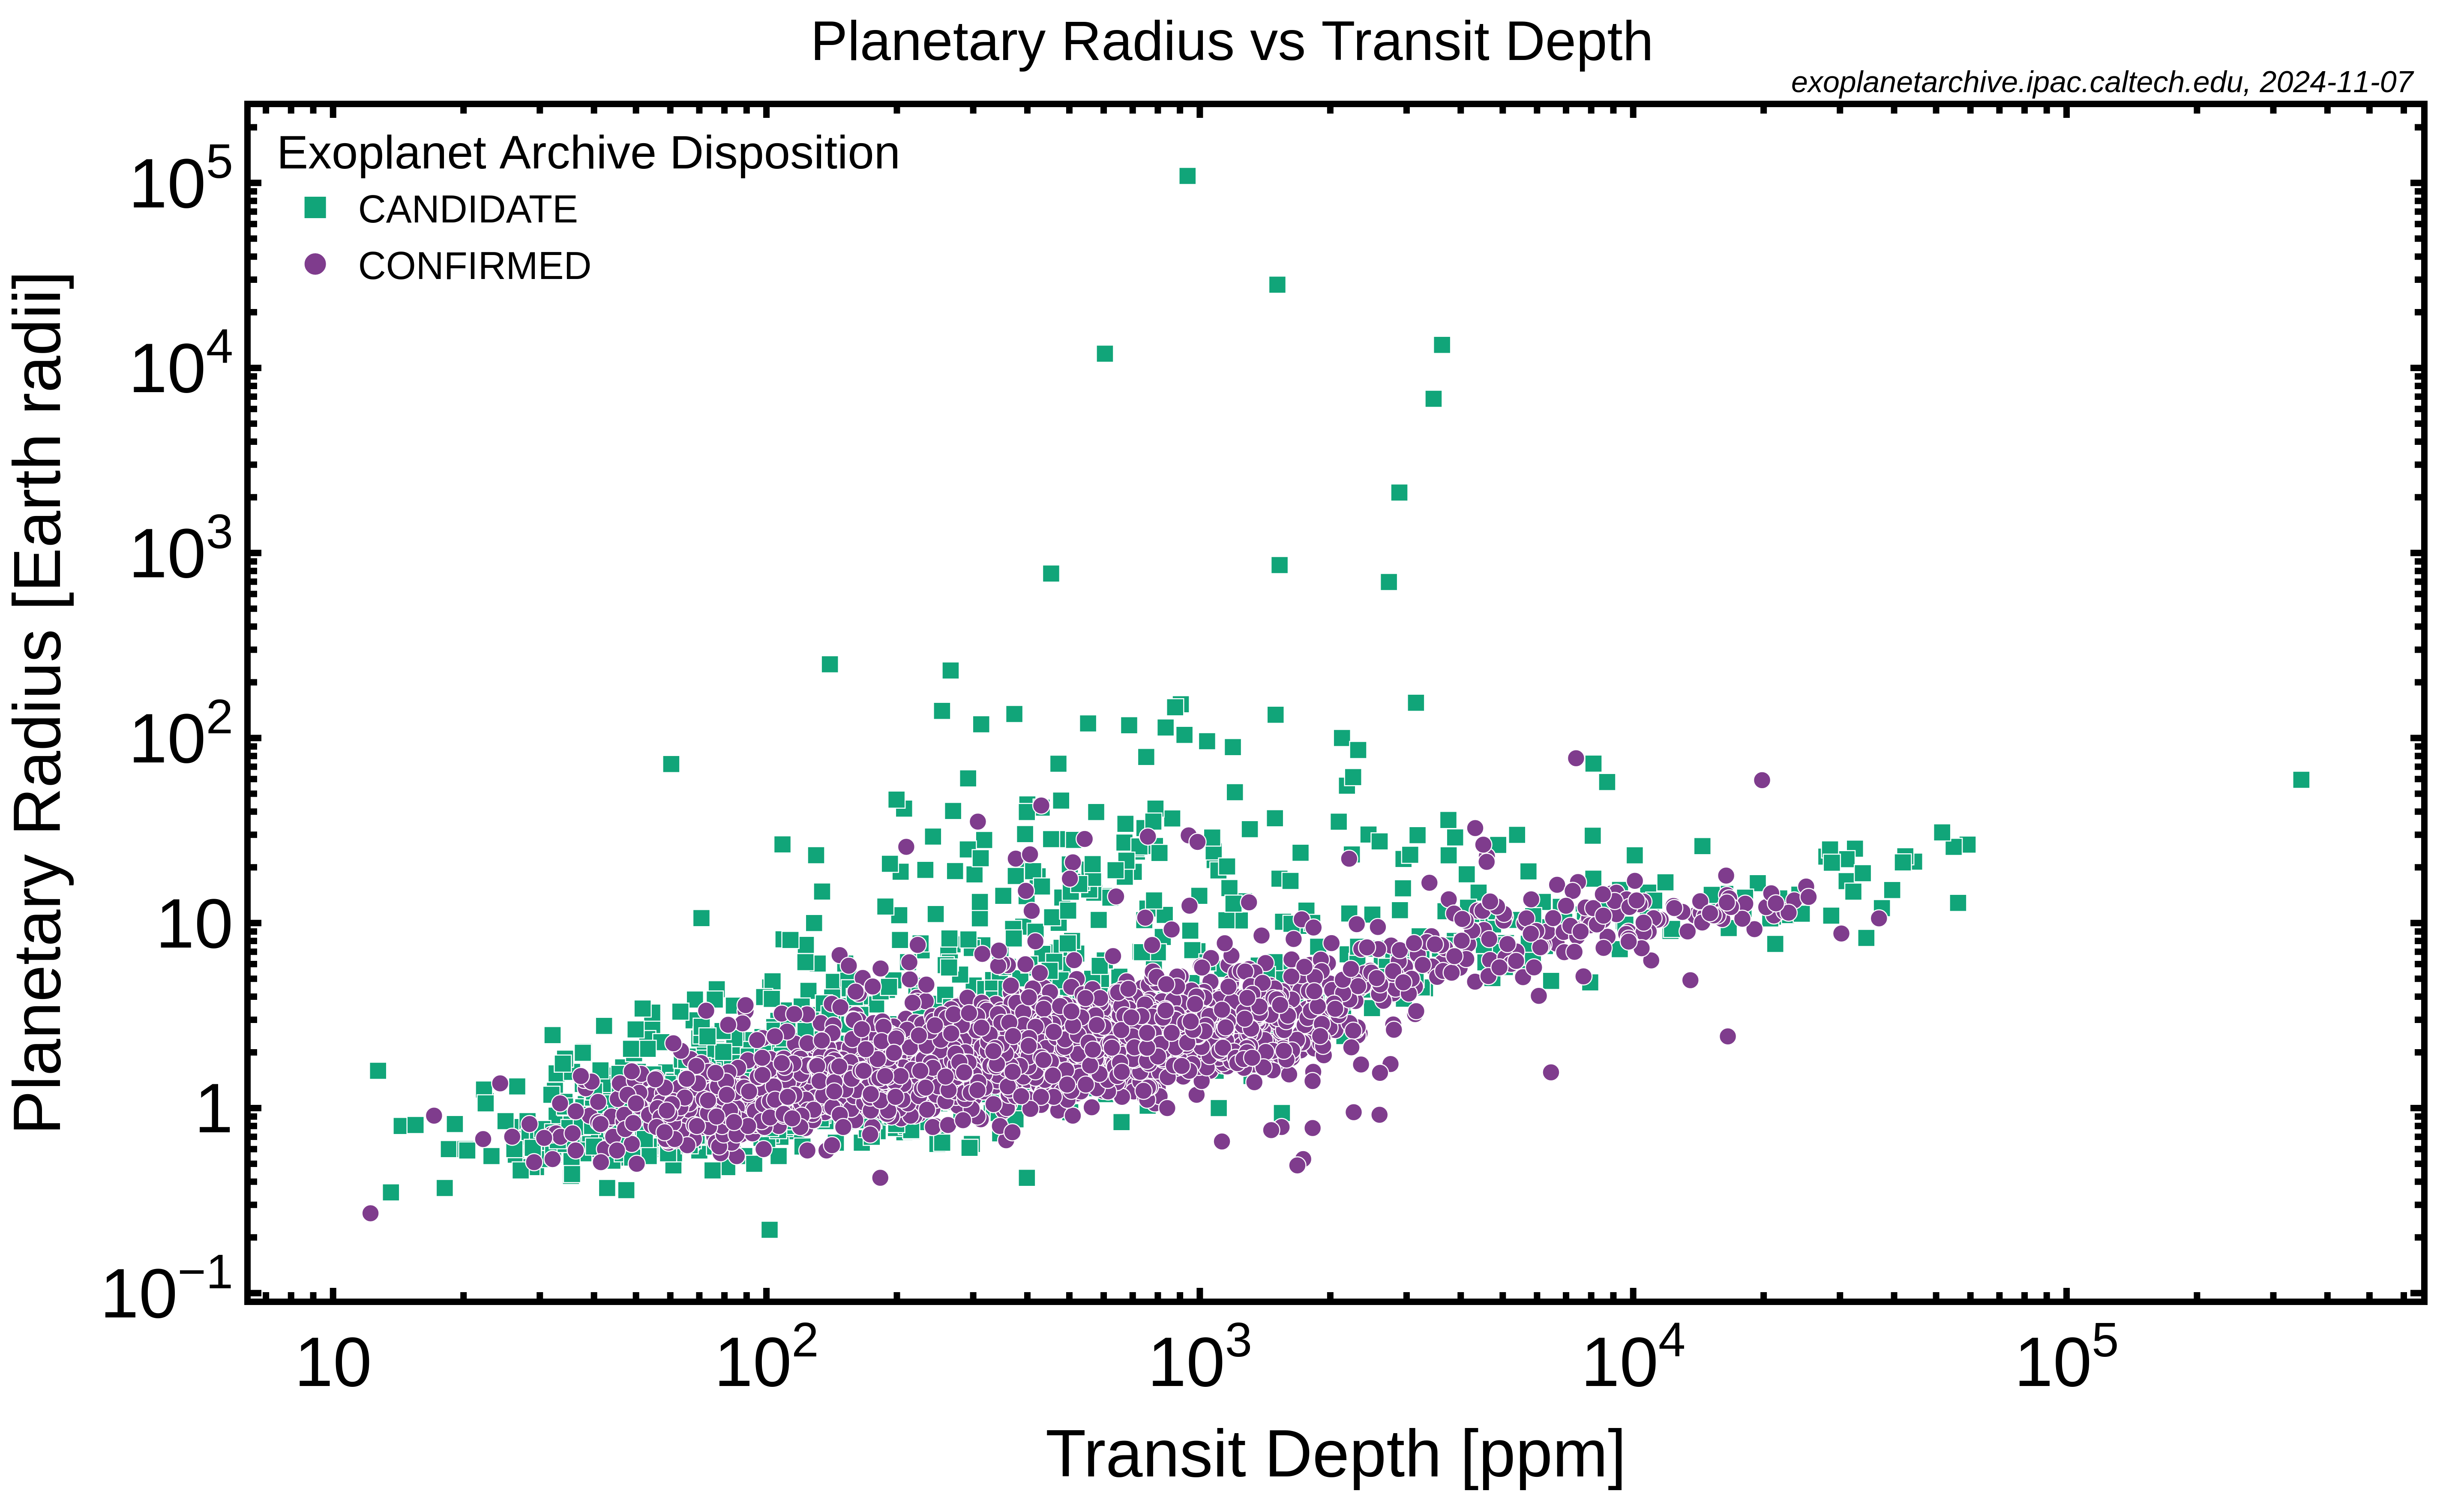
Kepler Candidates
The values plotted are those listed in the Cumulative KOI interactive table, including only objects with an Exoplanet Archive Disposition set to Confirmed (this category is also in the Planetary Systems table of confirmed planets) or Candidate.
|
|
|
|
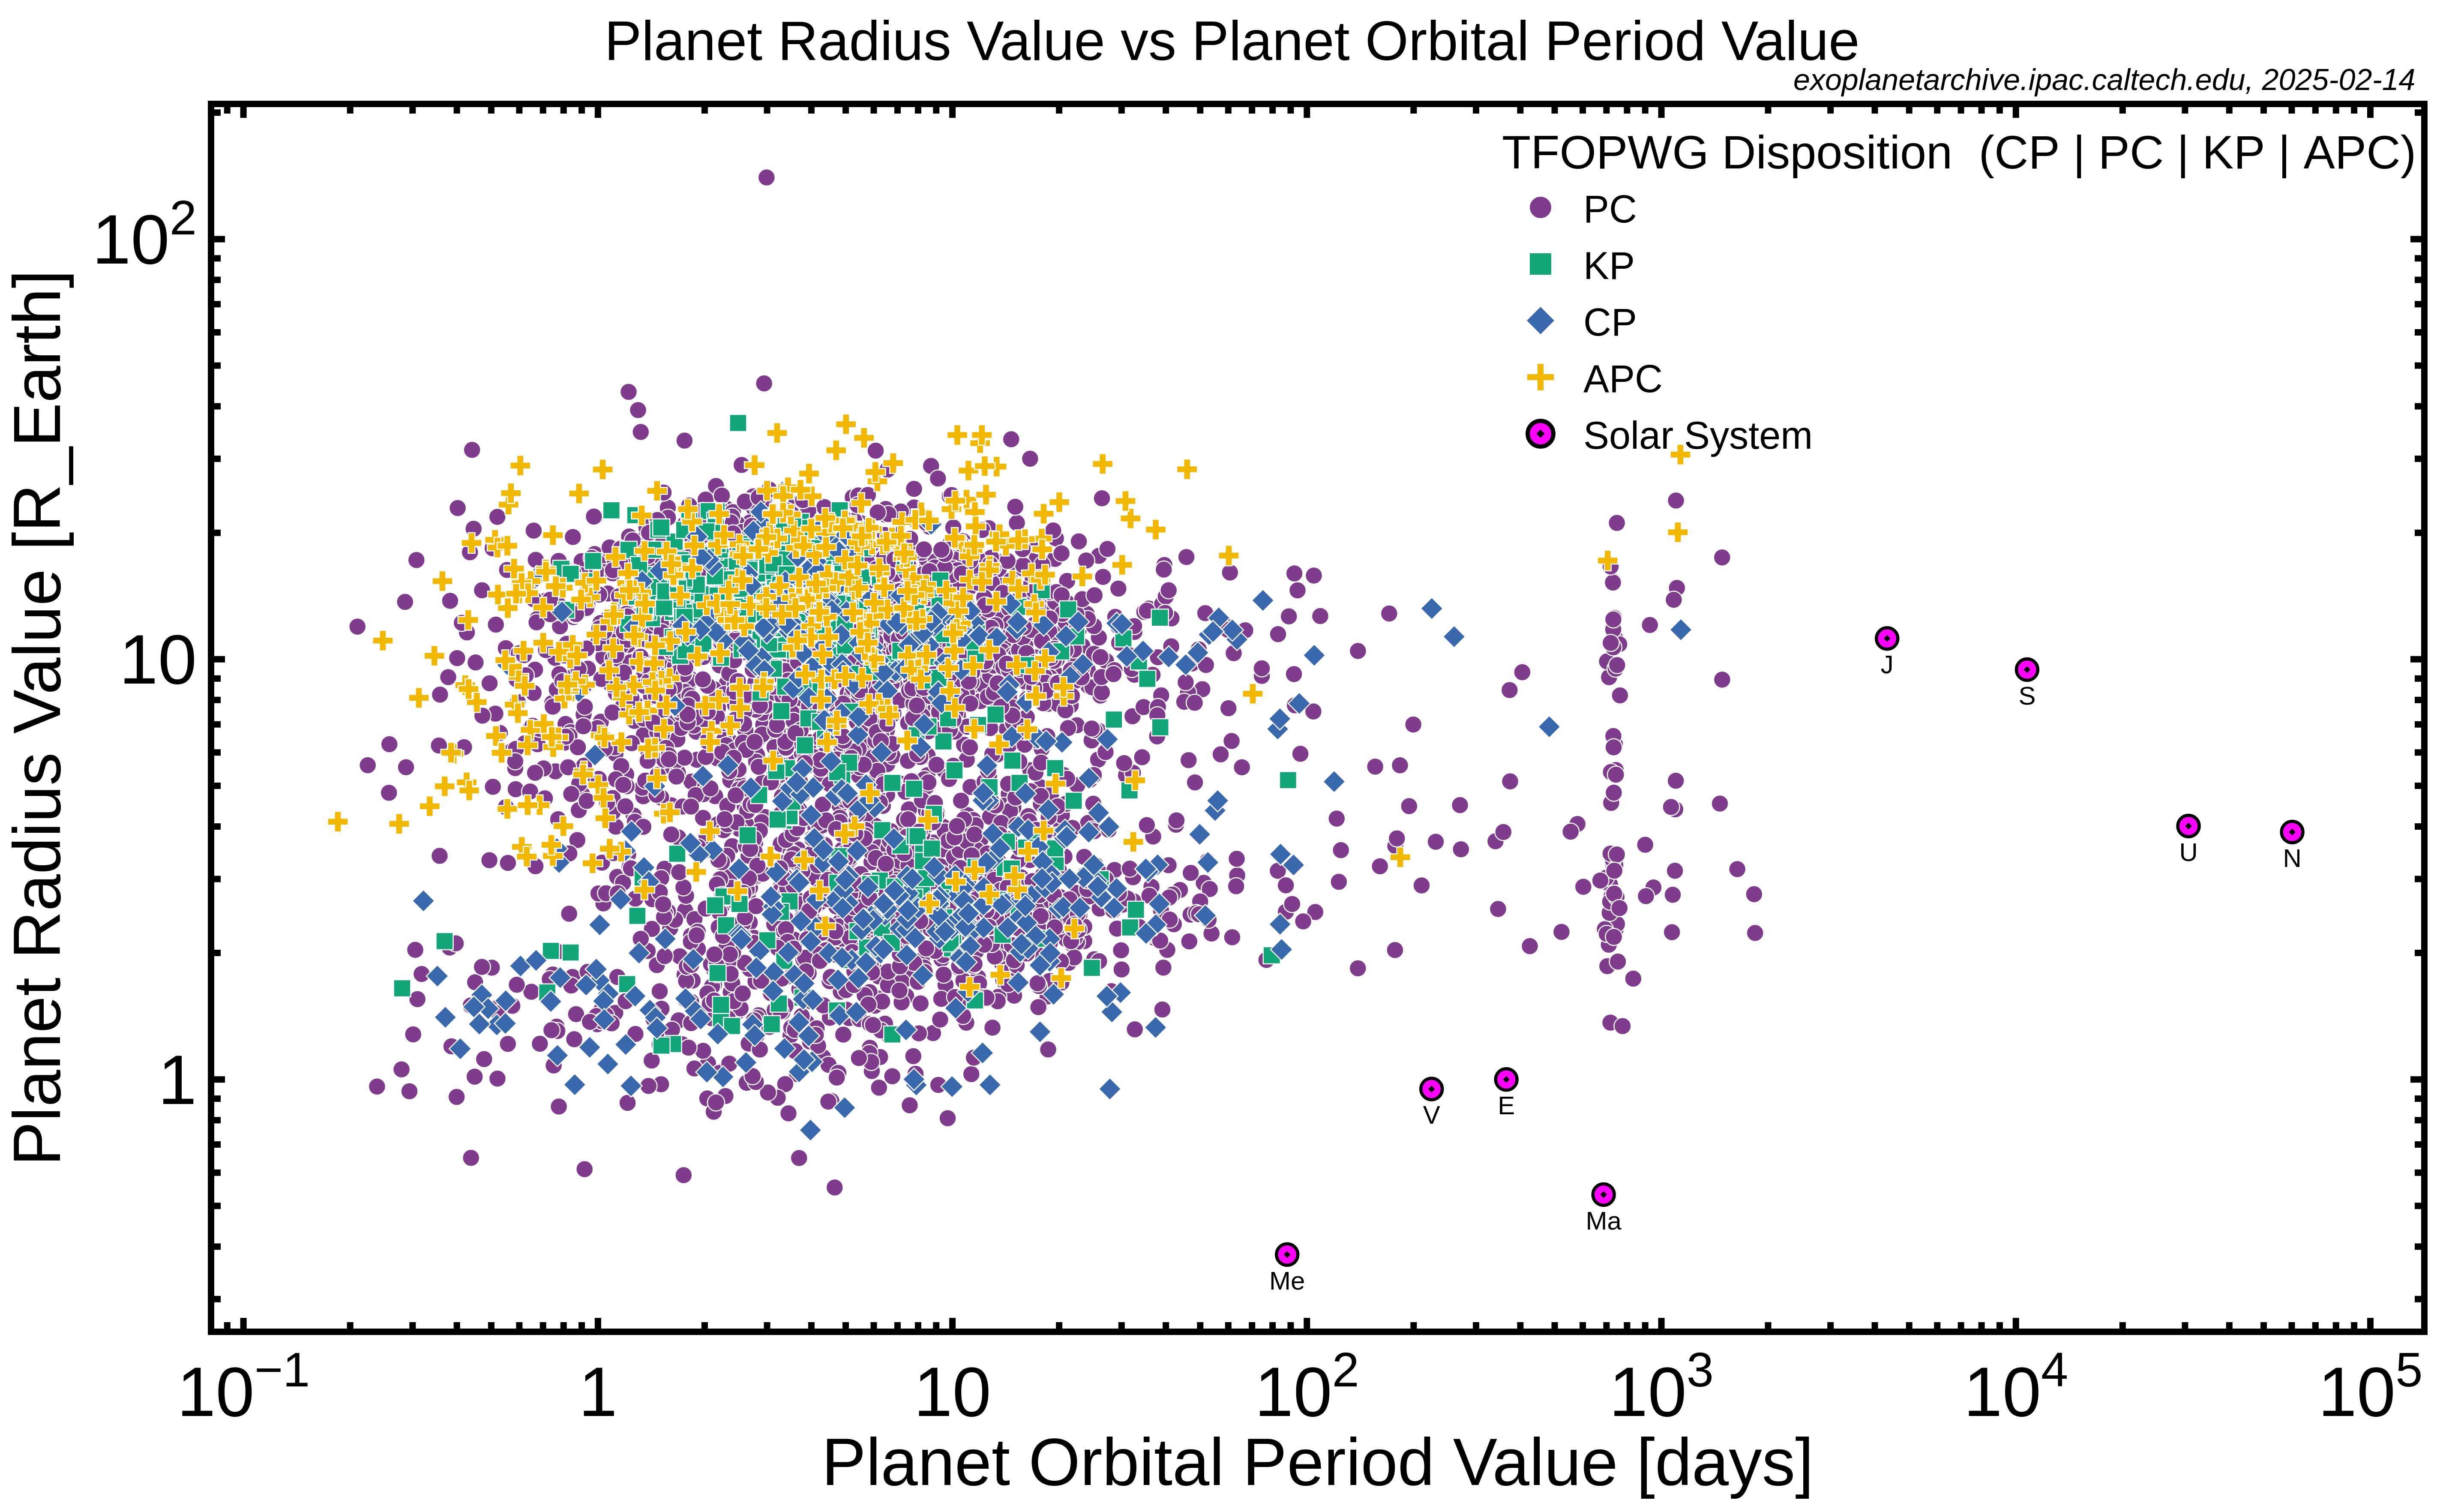
TESS Candidates
The values plotted are those listed in the TESS Project Candidates interactive table, excluding objects with a Disposition set to False Positive by the TESS Follow-up Observing Program Working Group (TFOPWG). Plotted values are grouped by the remaining Dispositions (CP=Confirmed Planet, PC=Planetary Candidate, KP=Known Planet, APC=Ambiguous Planetary Candidate). For comparison, the radius vs. orbital period plot includes the planets of the solar system.
|
|

JWST Atmosphere Observation List (NExoList)
The plot below uses composite parameters from the Planetary Systems Composite Parameters table to show all confirmed planets in mass–orbital period space. Gray markers indicate planets without JWST spectra. For planets with JWST spectra (currently not including JWST directly imaged planets), the marker symbol and color indicates which observation method (or combination of methods) was used to observe the planets:
|
|

Download Movies of Plots
We've made some short movies using our plots for use in presentations:
- KOI Radius vs. Period illustrates the progress of Kepler discoveries over time through July 2017.
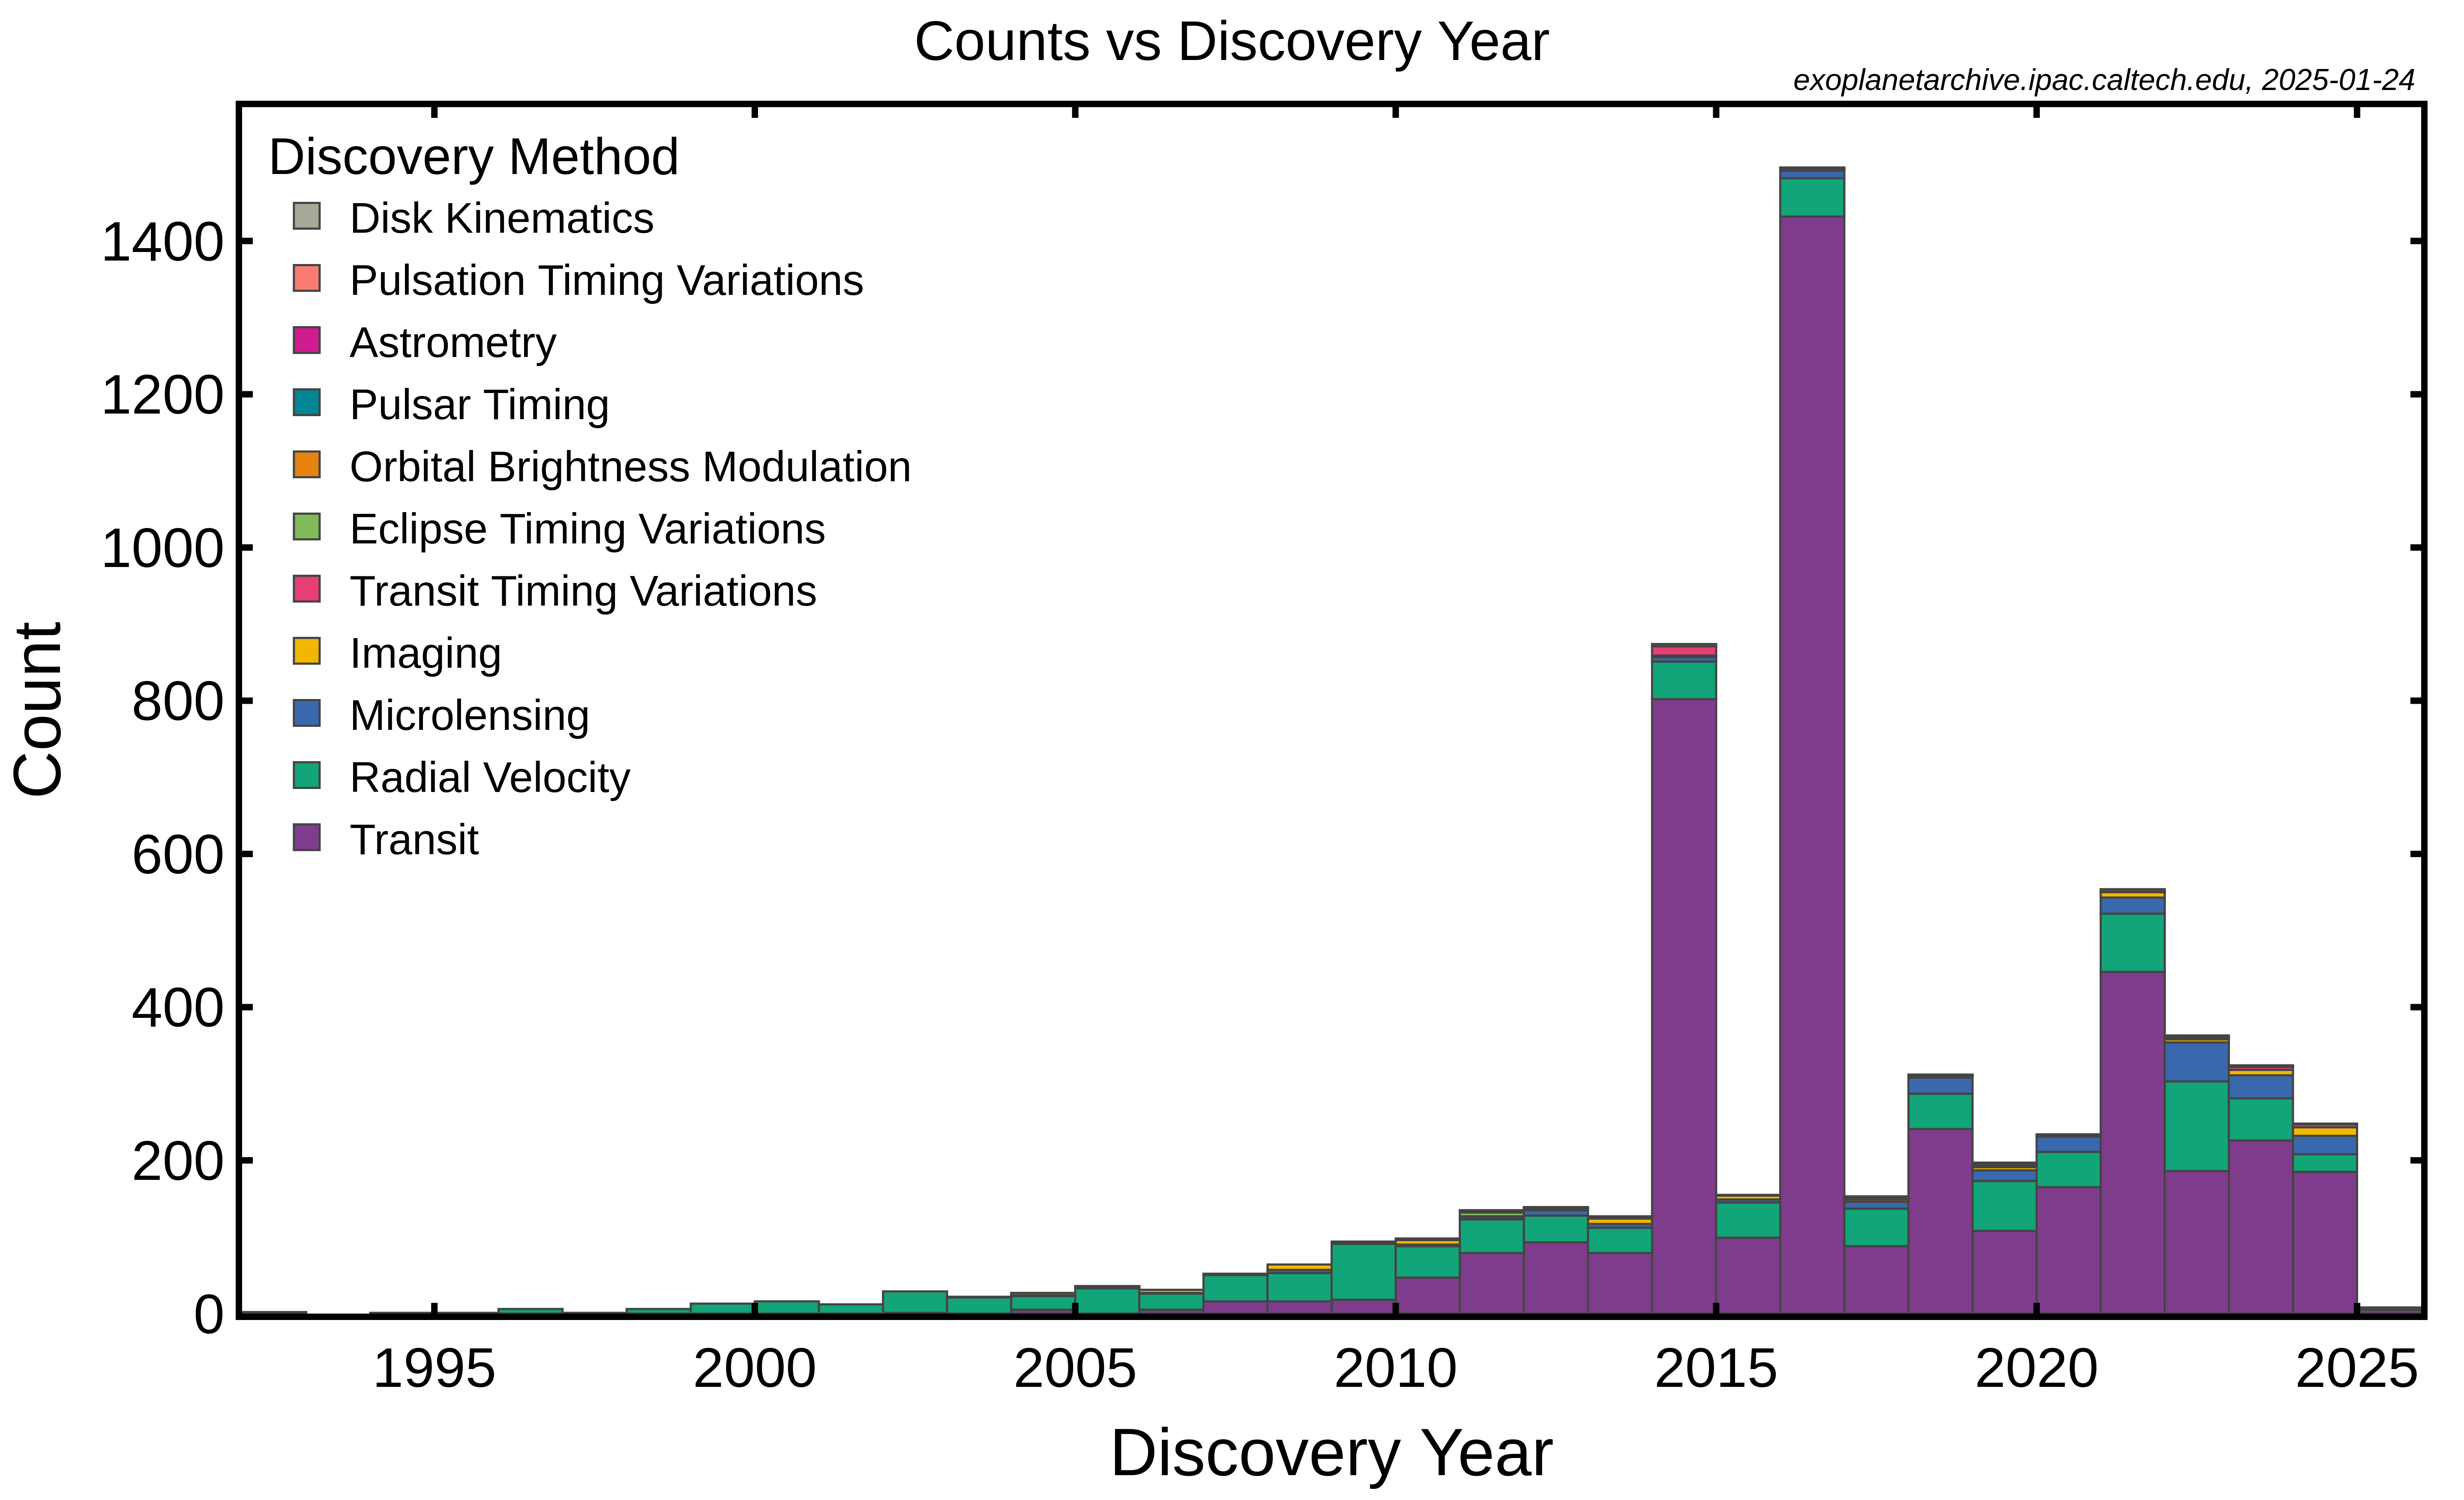
- Exoplanet Discoveries: Mass-Period Space shows the number of exoplanet discoveries by detection method in mass-period space from 1992 through September 2025.
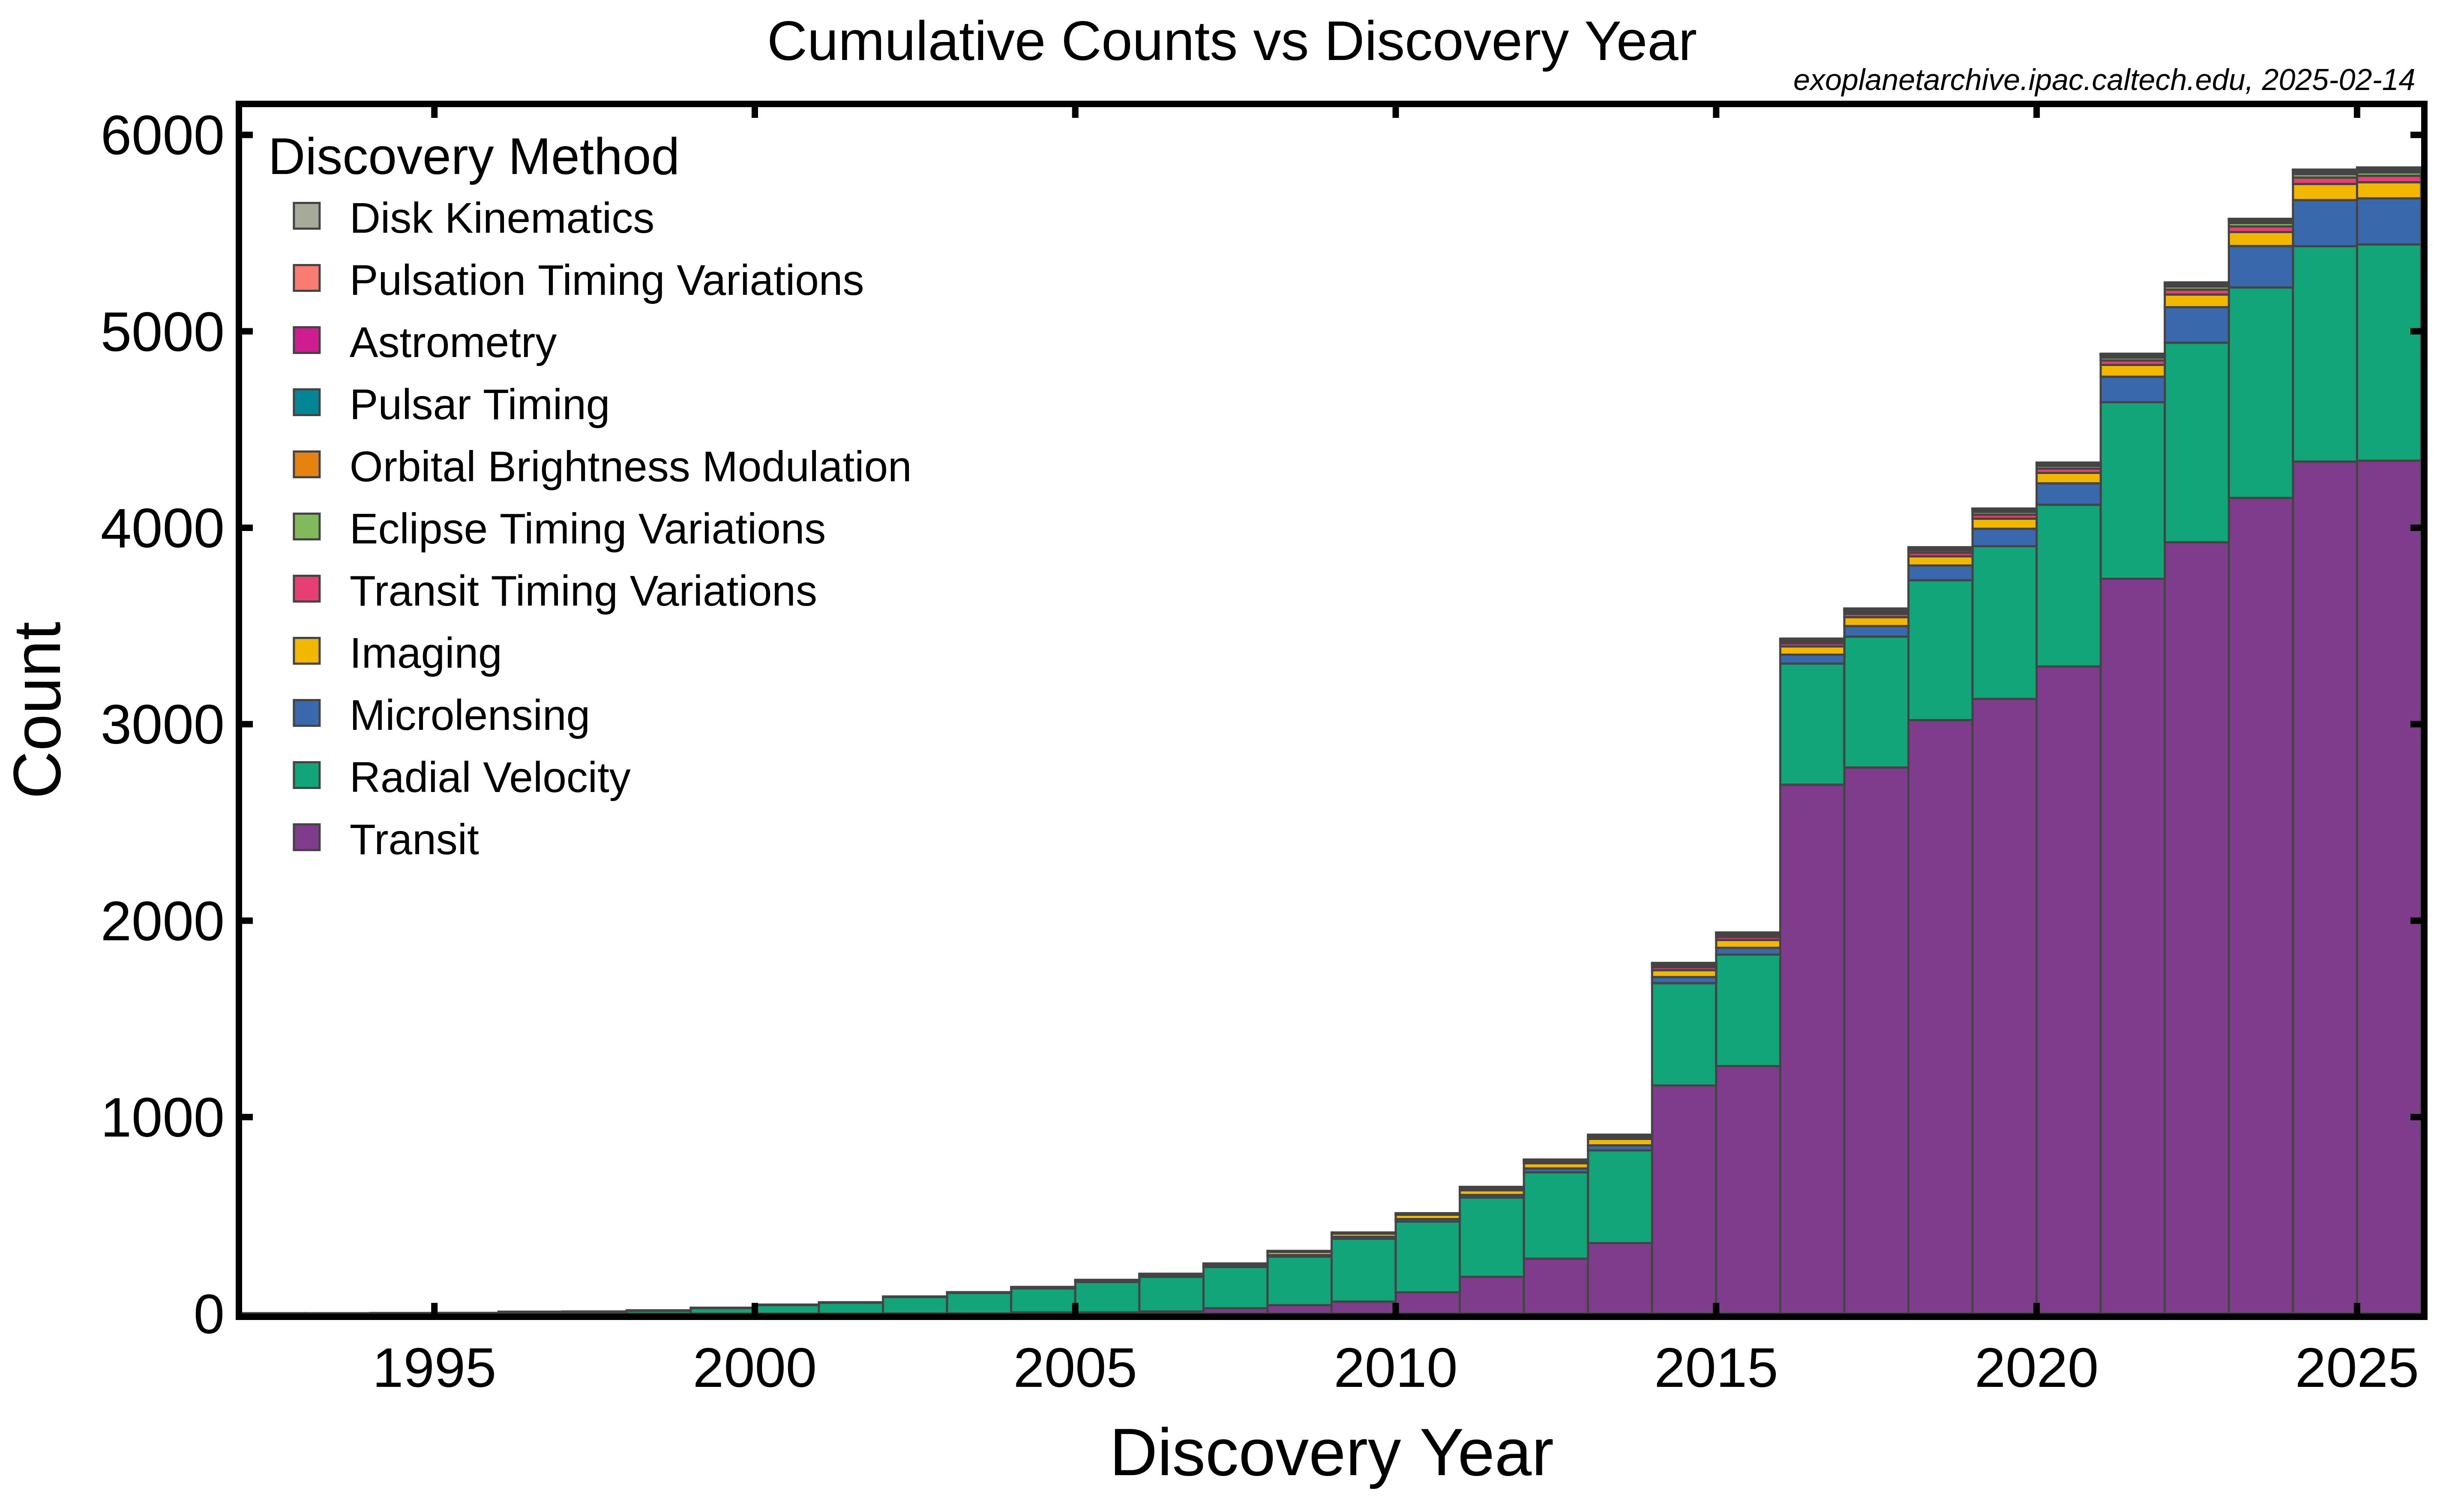
- Exoplanet Discoveries: Cumulative Histogram is a histogram showing the cumulative number of exoplanet discoveries by detection method each year from 1992 through September 2025.
If you have a suggestion for a new movie or pre-generated plot, please submit a Helpdesk ticket.
About These Plots
These pre-generated plots are produced whenever the archive database is updated, using available data within the NASA Exoplanet Archive, to ensure they are as current as possible. The purpose of these plots is to provide the community with fast access to presentation material that describe the current state of the exoplanets field in terms of their number and our understanding of their orbital and physical characteristics.
In all pre-generated plots, points are only shown for planets with all of the required parameters measured.


![]()
![]()