Viewing Predictions
User Guide
Using the Service:After you've submitted your target(s), observatory location, time span, and orbital phase(s) and clicked Predict Events on the Transit Service Query Form tab, the service automatically switches to the Results tab.
Working with the Results Table
The predictions are displayed in an interactive table that can be filtered, sorted, downloaded, and customized as needed. Each row contains data for one prediction.
It's important to note that only a subset of the available columns are displayed on this tab by default, and several new parameters were added with the most recent update to the Transit Service. For a complete list with descriptions, see Definitions of Transit Parameters.
To add and remove displayed data columns, click Select Columns to display the Column Controls pop-up menu, check or uncheck the columns to display, and click Update Selection. See the Interactive Table User Guide for in-depth instructions on using and modifying the table.
Viewing Transit Visibility Plots
If your query includes an Earth-based observatory or your own latitude and longitude coordinates, the Event Visibility Plot column will contain an Airmass Plot link that opens a new tab with an interactive Bokeh plot, similar to the following example:
(Click to enlarge)
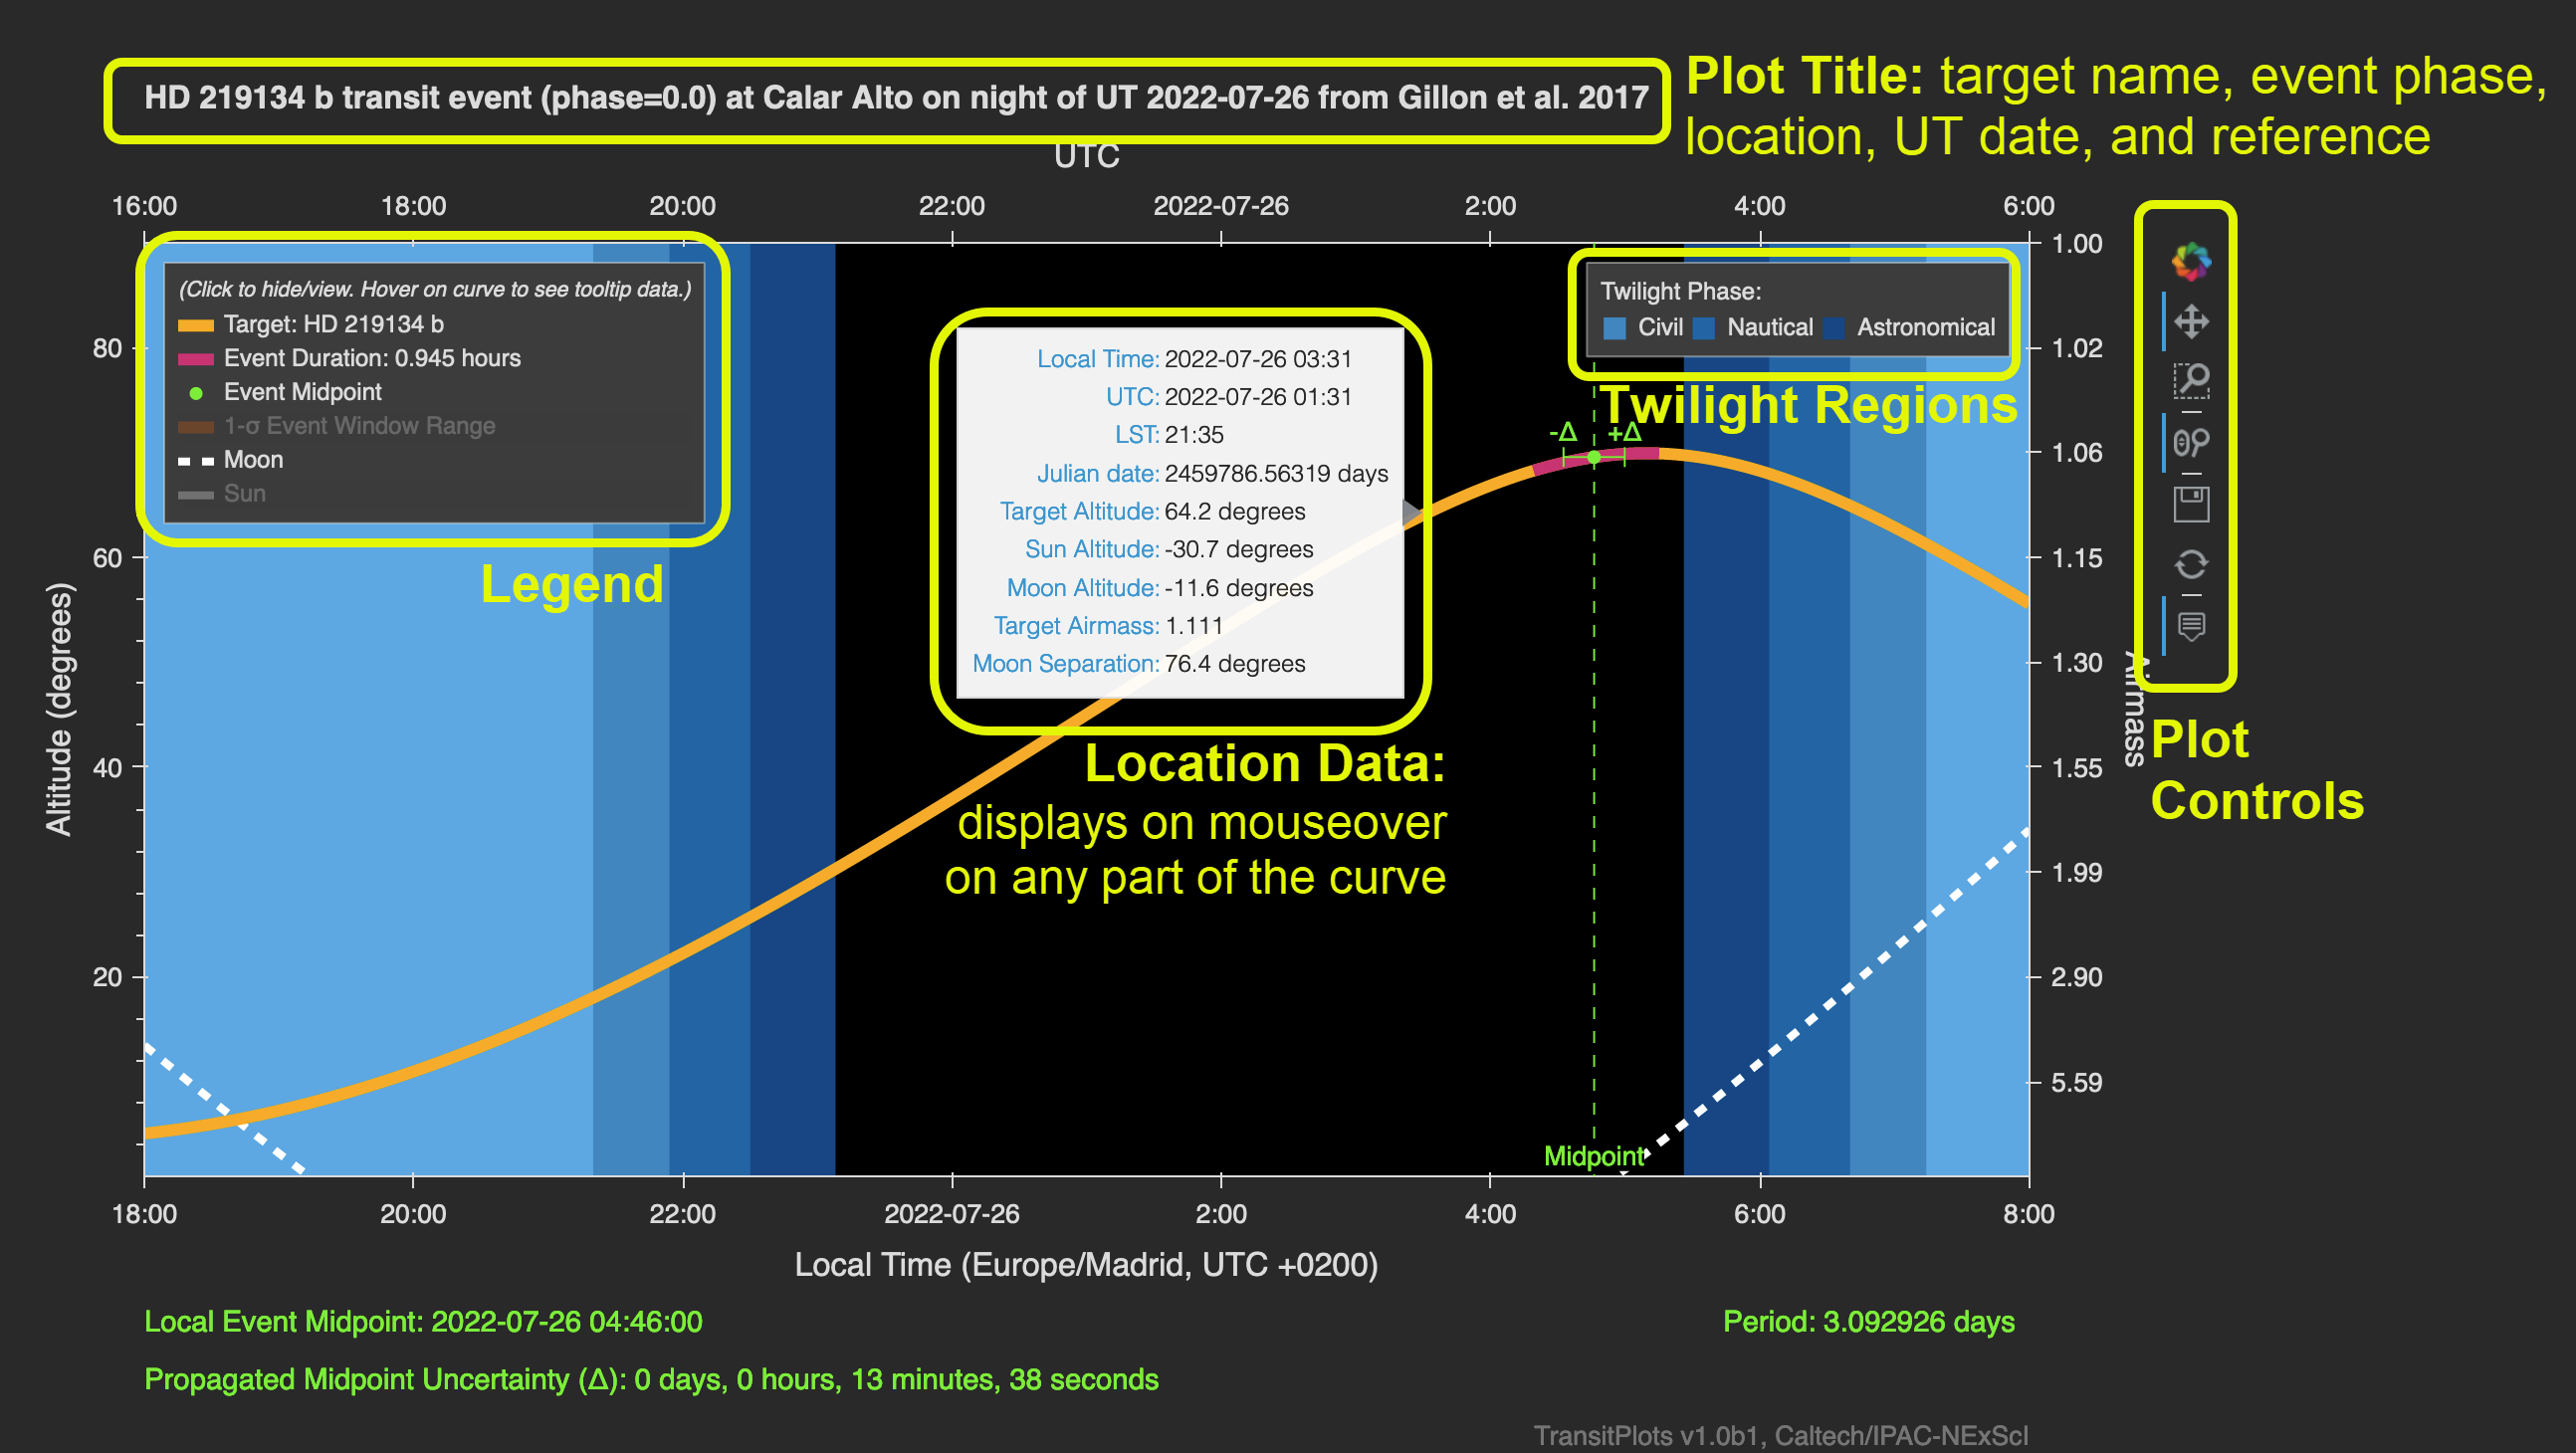
These plots show the altitude and airmass versus the local time and UTC of the target, with the transit event overplotted (event midpoint, midpoint uncertainty, event duration, and 1-sigma event window range). The altitude/airmass of the Moon is also shown by default, and the Sun can optionally be shown.
All of the displayed curves/points can be toggled on/off by clicking in the legend. Hovering the mouse over any part of the curve displays additional data for the hover location in a tooltip box: Local Time, UTC, LST, Julian date, Target Altitude, Sun Altitude, Moon Altitude, Target Airmass, and Moon Separation (angular distance from target).
The plot background shows twilight regions, with civil twilight, nautical twilight, and astronomical twilight regions specifically labeled.
The plot title shows the target name, event phase, name of observatory (or "Custom" if user-defined lat/lon was used), UT date of night, and reference.
In the lower-left area below the plot, the Local Event Midpoint and Propagated Midpoint Uncertainty are displayed. This is is also where any warnings are displayed, for example, if the propagated midpoint is over 3 hours or if the event duration or 1-sigma window are not available.
There is also a plot controls panel in the upper-right corner with tools to zoom (with mouse wheel or box select), pan, save, and reset the plot.Reviewing the Query Log
For troubleshooting or verification purposes, you may review your query's calculations on the Log tab.
«Previous Programmatic Results API Refining Transit Settings Next »
Last updated: 26 May 2026