Periodogram Recipe: Star with Confirmed Planet and Spots
User Guide
Using the Service:The following procedure demonstrates how to use stored Kepler data in the Exoplanet Archive and the Periodogram service to analyze the evolution of star spots on a star with a confirmed, short-period planet. There is another procedure that describes how to calculate a periodogram with your own input file.
Printer-friendly version
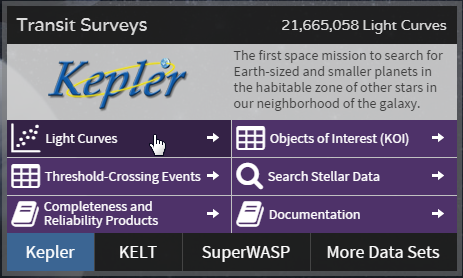
- From the home page, click the Kepler Light Curves button to access the Exoplanet Transit Survey Kepler Search page.
- In this example, we will use Kepler-17 (KIC 10619192). In the Kepler ID field, enter 10619192 and click View.
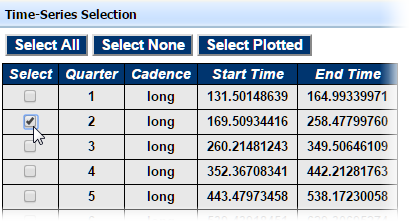
- From the result table, find row 2 (in the Cntr column) and note the Quarter, Start Time and End Time. For this example:
- Quarter: 2
- Start Time: 169 (rounded down from 169.50934416)
- End Time: 259 (rounded up from 258.4779976)
- Click the corresponding PDCSCAP link in the table row. to view the time series in the Time Series Viewer tool. The Data tab displays by default.
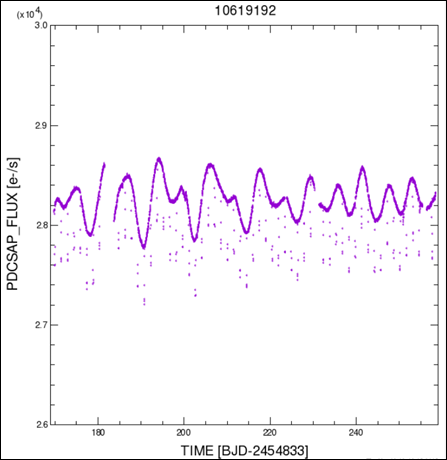
- Click the Axes tab and select Manual for both X-Axis and Y-Axis Scaling. Enter the following values:
- X-Axis Min: 169 Max: 259
- Y-Axis Min: 2.6e+4 Max: 3.0e+4
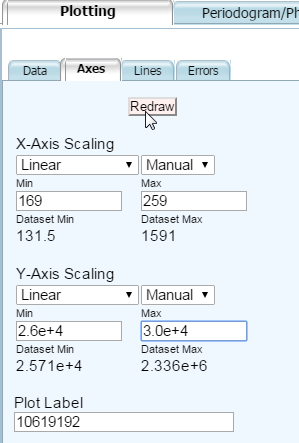
- Click Redraw to view the replotted data and compare your light curve result:
- Click the Periodogram/Phase Curve tab and select the checkbox for Quarter 2 Long Cadence, then click the Compute Periodogram button.
- Click Continue in the pop-up window. When the service finishes its calculation, the periodogram displays in the Periodogram Results window.
- Compare your result:
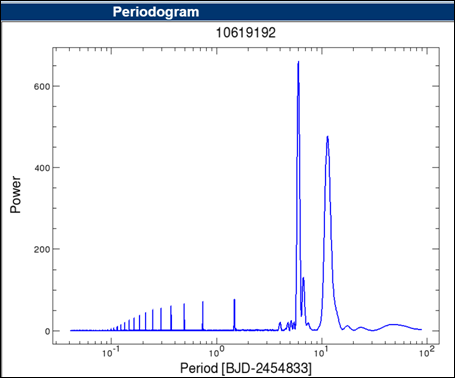
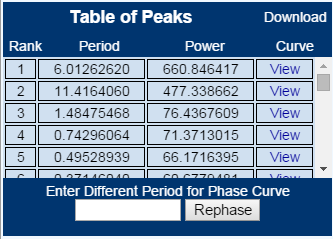
- To the right in the Table of Peaks, click the View link for peak #3 (listed in the Rank column) to view the folded phase curve. The planet transit can be clearly seen. Note that the two highest peaks in power are at longer periods than the planet (1.48 days) and correspond to the star spot rotation.
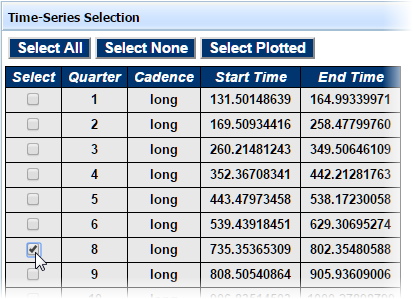
- Now, return to the Time Series Viewer and Periodogram/Phase Curve tab (the browser tab labeled 10619192: Time Series Visualizer) and de-select the Quarter 2 checkbox.
- Select the Quarter 8 Long Cadence checkbox and click Compute Periodogram.
- Click Continue in the pop-up window. The service will re-calculate your new request and display it in a new browser tab; previous results are not affected.
- In this result, there is only a single peak from the star spot rotation. Compare your result:
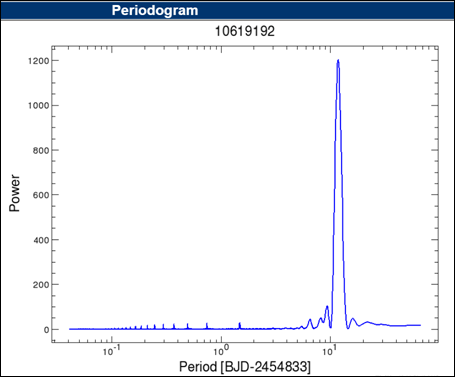
Note: You may select a new the line color from the Data sub-tab: check Override Multi-Dataset Symbol Selections, select a new Color and click Redraw. In this example, the color is changed to purple.
Last update: 26 April 2018