Periodogram Overview
User Guide
Overview
Using the Service:Periodograms are computed to extract periodic signals from time-series data. Calculating a periodogram is similar to computing a Fourier transform, in which the input data are transformed from the time domain to the frequency domain. The power at a candidate frequency indicates the strength of a repeating signal in the data at that frequency. The periodogram code returns two important results: the periodogram itself (the spectral power as a function of frequency) and a table of the peaks in the periodogram, with the associated probabilities that these peaks arise by chance.
Printer-friendly version
A variety of astrophysical phenomena can produce periodic times-series curves, including stellar variability, eclipsing binaries and transiting planets. Time-series curves of astrophysical objects are inherently noisy measurements: photon noise, atmospheric conditions and other factors can introduce random variation into the photometric magnitude of the observations. The intervals at which the measurements are taken are also generally uneven. Periodograms are used as a tool to identify and extract any intrinsic periodic signal from the data.
There are currently three algorithms that are supported by the Periodogram service: Lomb-Scargle, Box-fitting Least Squares (BLS) and Plavchan.
- Lomb-Scargle is an approximation of the Fourier Transform for unevenly spaced time sampling. It identifies periodic signals that are simple combinations of sines and cosines (sinusoids).
- Box-fitting Least Squares (BLS) is optimized to detect periodic transits by fitting the time-series to a repeating box-shaped curve. A "box" is the addition of two step functions with opposite sign and equal amplitude separated by some finite time.
- Plavchan is an algorithm that identifies periods with coherent phased time-series curves (i.e., those phased curves that are smoothest). There is no assumption about the underlying shape of the periodic signal with this approach.
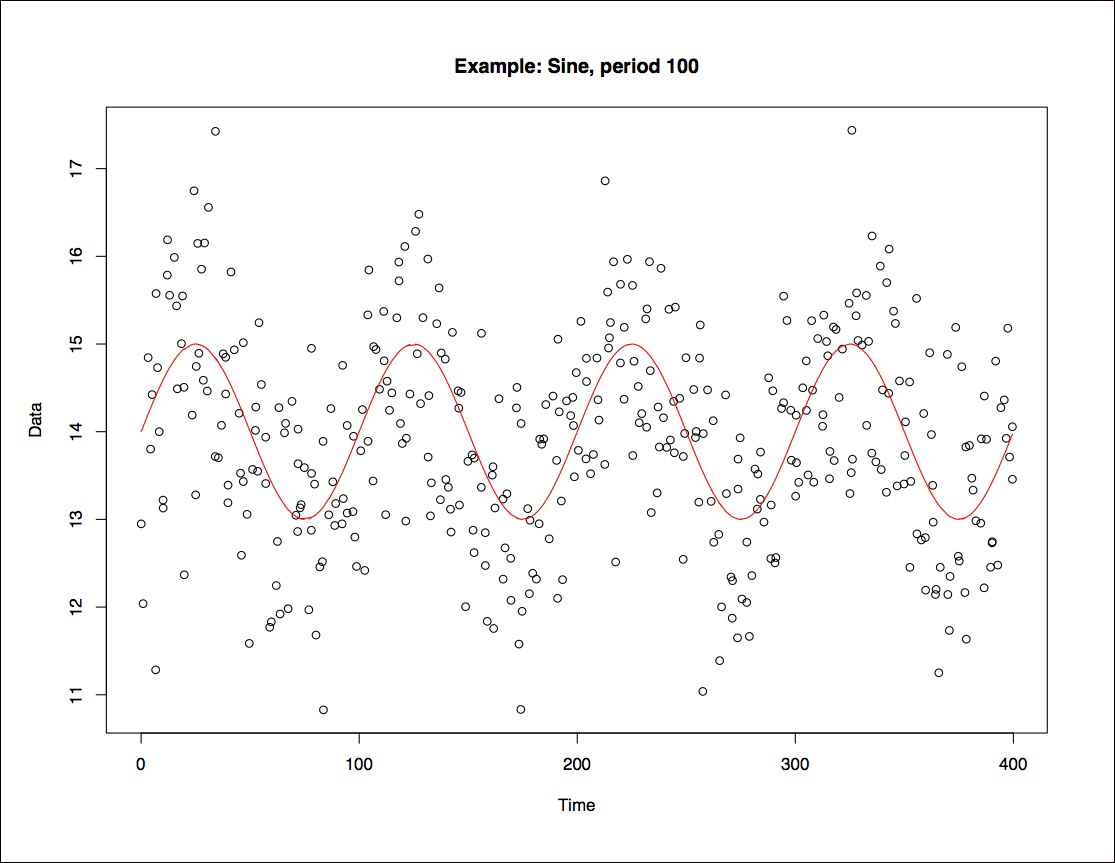
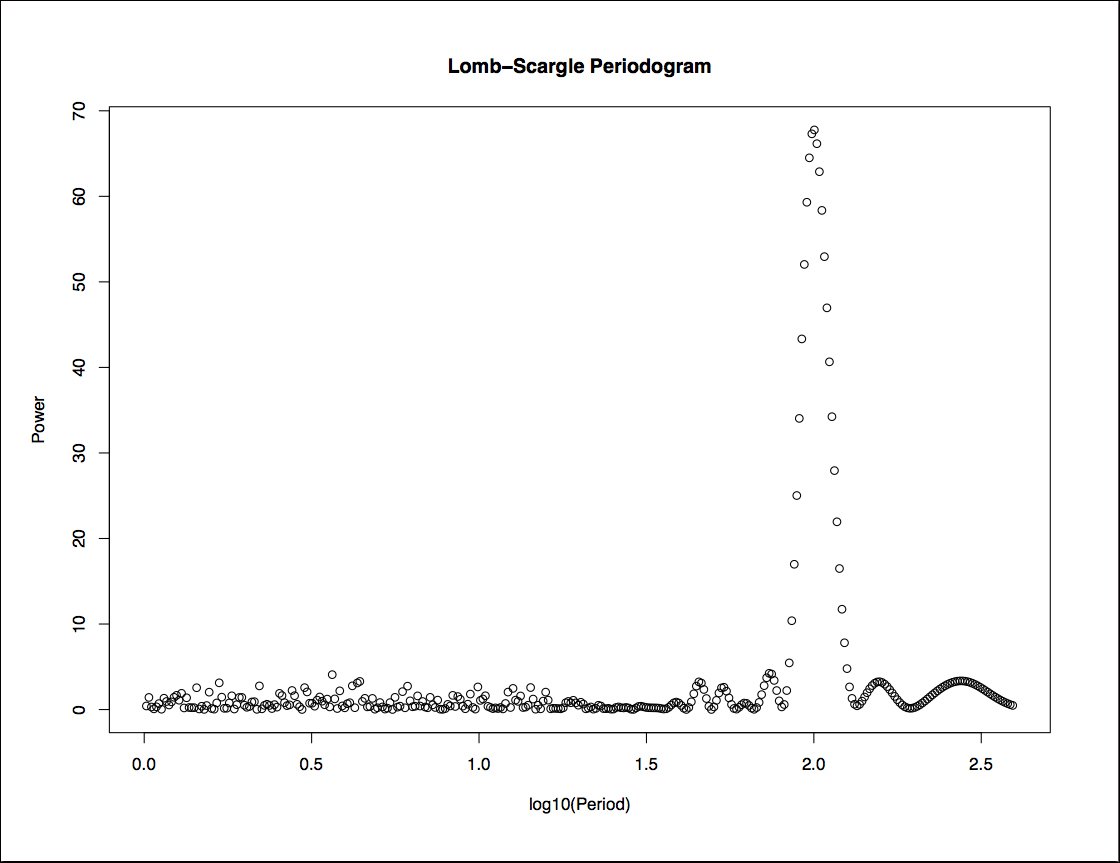
The example below shows a light curve and its periodogram, generated using the Lomb-Scargle algorithm. The peaks in the periodogram indicate a statistically significant periodic signal.
References
Scargle, J.D. "Studies in Astronomical Time Series Analysis II: Statistical Aspects of Spectral Analysis of Unevenly Spaced Data." Astrophysical Journal 263:835-853 (1982) Abstract
Horne, J.H., Baliunas, S.L. "A prescription for period analysis of unevenly sampled time series." Astrophysical Journal 302:757-763 (1986) Abstract
Kovacs, G., Zucker, S. and Mazeh, T. "A box-fitting algorithm in the search for periodic transits." A&A 391:369-377 (2002) Abstract
Plavchan, P., Jura, M., Kirkpatrick, J. D., Cutri, R.M., and Gallagher, S.C. "Near-Infrared Variability in the 2MASS Calibration Fields: A Search for Planetary Tranist Candidates." ApJS 175:191Y228 (2008) Abstract
Last updated: 26 April 2018