
Summary details for Amateur Light Curves
Introduction
These light curves are part of the Exoplanet Archive's holdings of amateur-contributed photometric data of transiting extrasolar planets, formerly archived at the Amateur Exoplanet Archive. As these data are not derived from peer-reviewed publications in the astronomical literature, this page provides necessary background information on the light curves. The need for an archive of amateur-donated precision photometric time series data of known exoplanet hosting stars was motivated by the fact that light curves of transiting planets carry significant scientific value but would not be easily accessible to the astronomical community if they were only available on private web pages. The Exoplanet Archive has thus started to host these light curves in a homogeneous format, thereby providing tools for basic analysis, cross-linked with other information about the observed star, and easy means of downloading the data file(s).
Data described on this page were typically taken with privately owned telescopes over the course of a (fraction of a) single night and contain relative photometric time-series data of predicted transit events of known extrasolar planets. These light curves can be influenced by systematic uncertainties of which three are typically dominant:
- temporal trends due to misalignment of the polar axis of the equatorial-mount telescope, which causes image rotation, and, in turn, produces statistically correlated noise as the star field moves across an imperfect flat field
- air mass trends that produce differences in star color between the target star and reference stars
- scintillation noise due to the smaller telescope apertures
The Exoplanet Archive serves both the original time series data and the time series data after the empirical removal of systematic effects. This empirical removal and subsequent calculation of a parametric fit to the transit signal in the light curve were performed by Bruce Gary, the webmaster of the Amateur Exoplanet Archive. The data with systematics removed are displayed within the Exoplanet Archive visualization pages to enable the user to assess the quality of the light curve. The raw photometric data are contained in the downloadable light curve file to allow the user to analyze the data on his/her own.
Below is a summary description of the empirical fitting routine employed by Bruce Gary, but details are available here.
Description of Empirical Fitting Routine
The empirical fit used to calculate the systematic trends in the light curve and transit parameters of the exoplanet / star system is intended to work on amateur light curves and, by design, a number of assumptions and simplifications are made to make it flexible and applicable to the amplitude of variations seen in amateur light curves. The calculated fitting parameters should therefore be regarded only as an estimate of the system parameters, but should not be used as the final values.
A typical light curve can be described empirically via a seven-segment empirical fit described by the following parameters (see also Figure 1):
- Zero point offset
- t1: Beginning of ingress - labeled 1 in Figure 1.
- t2: End of ingress - labeled 2 in Figure 1.
- t3: Beginning of egress - labeled 3 in Figure 1.
- t4: End of egress - labeled 4 in Figure 1.
- L: length of transit from t1 to t4
- MD: mid-point of transit
- D: Transit depth at transit midpoint (MD)
- Fp: Partial transit fraction; Fp = [ (t2-t1) + (t4-t3) ] / (t4-t1)
- F2: Fractional transit depth at t2 (with respect to D)
- Temporal trend, i.e., slope of light curve without the transit [mmag/hour]
- Airmass trend [mmag/airmass]
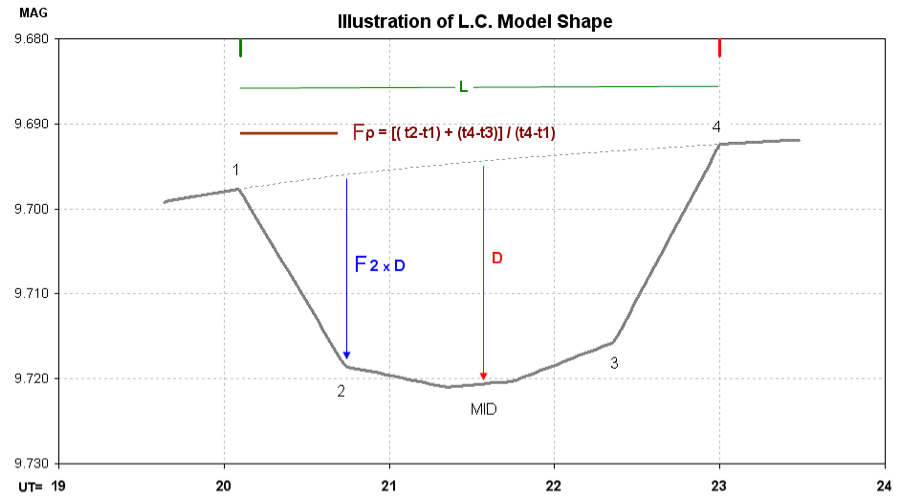
Figure 1: Light curve shape model used in fitting AXA submitted transit data when temporal and airmass trends are present. See text for details.
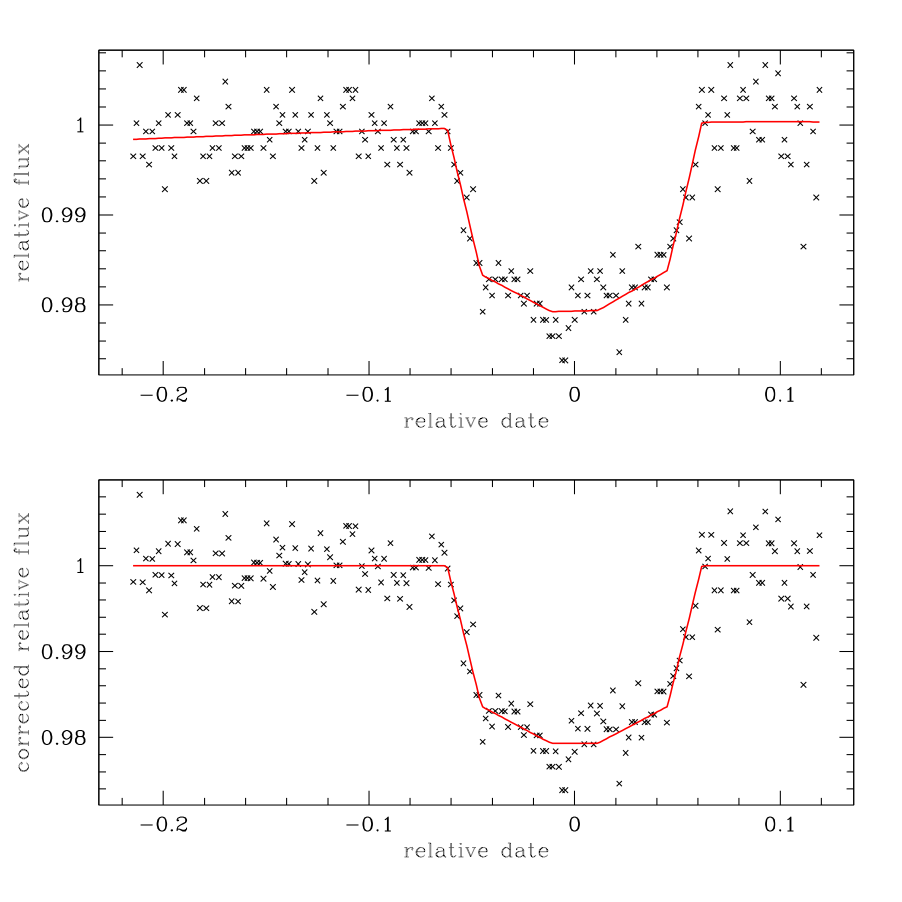
Figure 2: Example of removal of systematics from light curves. The top panel shows the raw data and corresponding model fit, the lower panel the same data after the systematics were removed.
Description of Header Parameters
The headers and columns for the downloadable light curve files are self-describing. However, a few items particular to the amateur light curves are described here.
From the parametric fit of the raw photometric data, the following light curve parameters are listed in the header under the section entitled: "Time Series Data Fitting Results". As mentioned above, these parameters should only be taken as parametric estimates to the true values:
- Transit midpoint: the time of transit center in days
- Transit duration: the duration from the beginning of ingress through the end of egress in hours
- Transit depth: depth of transit at transit midpoint (D in Figure 1) in millimagnitudes
- Partial Transit Fraction: the fraction of the transit duration that is comprised by ingress plus egress
- Fractional transit depth at t2: the depth of the transit at t2 divided by the depth of transit at transit midpoint
The data columns in the light curve file are the following:
- HJD: heliocentric Julian date of measurement, measured in days [plotted on x-axis by default]
- Relative Date: offset from calculated transit midpoint, measured in days
- Phase: phase of light curve, after folding it by published period
- Relative Flux: flux relative to out-of-transit flux (raw measurement)
- Relative Flux Without Systematics: flux relative to out-of-transit flux after (non-transit) systematics are removed [plotted on y-axis as default]
- Difference Data Vs Model: point to point differences between data and transit model fit (data - fit)
- Model Fit: estimated transit model plus systematics fit to the raw data
- Model Fit Without Systematics: transit model empirical fit with systematics removed
- Airmass: airmass value of each measurement
Additional Notes
The empirical fit used to calculate the systematic trends in the light curve and transit parameters of the exoplanet / star system is intended to work on amateur light curves and, by design, a number of assumptions and simplifications are made to make it flexible and applicable to the amplitude of variations seen in amateur light curves. The calculated fitting parameters should therefore be regarded only as an estimate of the system parameters, but should not be used as the final values.
Downloading of amateur data files is unrestricted. However, since these data are unpublished, it is recommended the observer be contacted prior to use of data. The observer may be aware of specific aspects of the data that should be taken into consideration when interpreted, such as seeing, clouds, wind, scintillation, clock-setting procedures, optimized photometry apertures, etc. If these data are to be used in a publication, it is requested that the observer be acknowledged by name along with a brief description of the hardware used.


![]()
![]()