
Microlensing Observations in Astrophysics (MOA) Survey Overview
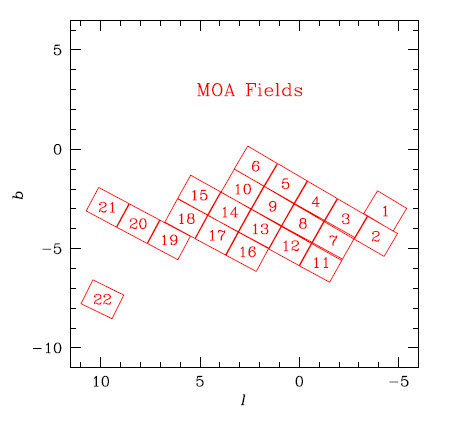
The NASA Exoplanet Archive serves the public survey data from the Microlensing Observations in Astrophysics (MOA) collaboration, which operates a joint Japanese-New Zealand ground-based microlensing survey. In total, the current public data release includes approximately 2,400,000 photometric light curves, acquired from 2006–2014, using the 1.8-meter MOA telescope located at Mount John Observatory in New Zealand. These data span 22 target fields, the locations of which are shown in the observational coverage map below, were produced and had candidate microlensing events selected using the methodology described below.
Prior to December 2023, the archive served ~6,000 photometric light curves from the MOA collaboration. That earlier dataset has since been subsumed by the larger, subsequent release that is currently served by the Exoplanet Archive through this page.
NASA Exoplanet Archive MOA Resources
The NASA Exoplanet Archive hosts photometric light curves for approximately 2.4 million microlensing events detected by the ground-based MOA microlensing survey, totaling roughly 17 GB of data. See the links below to download these data, either as a complete data set (first link in table below), or by specific observational field (subsequent links in table below). Full column descriptions for each light curve are given in the Data Columns page.
Additionally, we provide tables with positional information as well as microlensing fit parameter values, derived by the MOA collaboration, for ~6,000 initially identified sources. Refer to the link in the last row of the table, below).
| Download Links (.tar) | Notes | |
|---|---|---|
| Individual Fields | MOA field gb1 (66 GB) MOA field gb2 (57 GB) MOA field gb3 (200 GB) MOA field gb4 (262 GB) MOA field gb5 (474 GB) MOA field gb6 (7.3 GB) MOA field gb7 (29 GB) MOA field gb8 (73 GB) MOA field gb9 (402 GB) MOA field gb10 (206 GB) MOA field gb11 (21 GB) MOA field gb12 (26 GB) MOA field gb13 (50 GB) MOA field gb14 (198 GB) MOA field gb15 (31 GB) MOA field gb16 (21 GB) MOA field gb17 (49 GB) MOA field gb18 (40 GB) MOA field gb19 (16 GB) MOA field gb20 (15 GB) MOA field gb21 (12 GB) MOA field gb22 (3.3 GB) |
These are individual download files for each field. Column definitions are provided on the MOA Data Columns page. |
| Supplemental Data | Metadata (93 MB compressed; 2.9 GB uncompressed) |
metadata.ipac: This file contains positional information for each of the ~2.4 million objects for which light curves are presented here, as well as the event selection and microlensing fit parameter values for a subset of approximately 6,000 sources. |
Data Products Description
The MOA dataset consists of two components: a collection of approximately 2.4 million light curves and a table containing the metadata for all the light curves. Each light curve is presented as a table in this dataset. Each row in each light curve table corresponds to a moment in time when an observation was made and the related measurements and derived values for that observation. Each row in the metadata table corresponds to a light curve. There is one row in the metadata table for each light curve in the dataset. The metadata row contains observational information about the light curve (e.g., location on the sky) for all sources and relevant microlensing candidate selection information (e.g., the initial point-source-point-lens parameters found to fit the event) for the ~6,000 initially released sources.
The complete list of data columns and their definitions are provided on the MOA Column Documentation page.
Observational Coverage Map
This figure identifies the 22 target fields observed by the MOA survey, from which the approximately 2.4 million light curves were produced. Approximately 6,000 candidate events were identified. (Click for larger image)
Data Selection Criteria
Here we describe the criteria used by the MOA collaboration to identify and select as microlensing events the approximately 6,000 objects presented here. This methodology is a slight variation of what is described in the Supplementary Information section of Sumi, T., et al. (2011) Nature, 473, 349. Please refer to that manuscript for additional details.
- Cut-0:
- Cut-1:
- The candidates were selected by eye inspection of these objects.
On a subtracted image, variable objects can be seen as positive or negative point spread function (PSF) profiles depending on whether the target star is brighter or fainter than in the reference image. We use a custom implementation of the IRAF task DAOFIND to detect these variable objects (like microlensing events), with the modification that both positive and negative PSF profiles are searched for simultaneously. This algorithm finds difference image peaks with a signal-to-noise ratio (S/N) > 5 and then applies several additional criteria to avoid the detection of spurious variations that are not associated with stellar variability, such as cosmic ray hits, satellite tracks and electrons leaked from the saturated images of bright stars. The positions of detected objects are checked against those obtained in previous reductions of the field. When no object is cross-referenced, the object is classified as new and added to the list of variable object positions. If an object has previously been detected within 8 days, the number of continuous detections for this object, Ndetect,continue, is incremented. We require that maximum of Ndetect,continue to be > 2.
Light curves of the candidates passing Cut-0 were then created using PSF fitting photometry on the difference images. The photometric error bars were calibrated with constant stars in each sub-field. We place a 1400-day moving window on each light curve and define the baseline flux to be the weighted average flux outside of that window. We require the baseline to have more than 100 data points and calculated χ2out/dof for a constant flux fit. We then search for positive light curve "bumps" inside the 1400-day window, with a "bump" defined as a brightening episode with more than 3 consecutive measurements with excess flux > 3σ' above the baseline flux, Fbase. We define a statistic χ3+ = Σi (Fi - Fbase) /σi' summed over consecutive points with Fi - Fbase > 3σi'. We cut the objects if χ3+ < 40 or ( χ3+ < 75 && χ2out/dof > 3).
This sample include candidates that may be cut by microlensing light curve fitting in the detailed analysis.
Software Used to Create the Dataset
DoPHOT
DoPHOT is a common point spread function fitting (PSF) photometry program. DoPHOT uses a analytical function (a polynomial approximation to a 2-D Gaussian) to represent stellar profiles.
MOA Data Acknowledgement
If you make use of data from this archive, please include the following acknowledgement:
This paper makes use of data obtained by the MOA collaboration with the 1.8-metre MOA-II telescope at the University of Canterbury Mount John Observatory, Lake Tekapo, New Zealand. The MOA collaboration is supported by JSPS KAKENHI grant and the Royal Society of New Zealand Marsden Fund. These data are made available using services at the NASA Exoplanet Archive, which is operated by the California Institute of Technology, under contract with the National Aeronautics and Space Administration under the Exoplanet Exploration Program.
Last updated: 13 December 2023


![]()
![]()