Viewing, Filtering, Downloading, and Plotting Spectra
User Guide
- About the Atmospheric Spectroscopy Table
- Getting Oriented with the Table Interface
- Viewing, Filtering, Downloading, and Plotting Spectra
- Spectroscopy Calculations
- Data Column Definitions
- Tips and Troubleshooting
The Atmospheric Spectroscopy Table was built on the Firefly framework, which is a package of science data archive components that provide an interactive, multi-panel web interface for browsing, visualizing, and working with astronomy data.
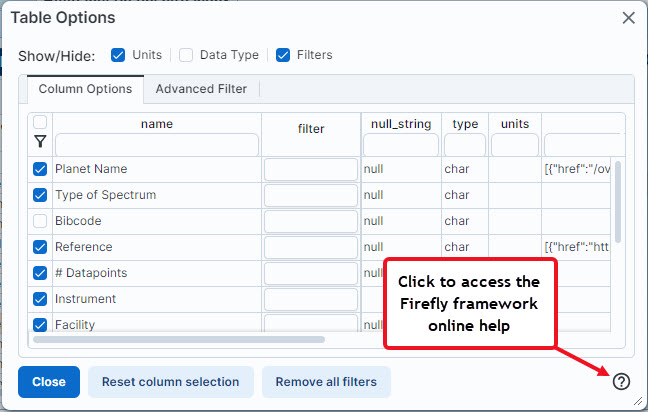
The table uses a subset of Firefly's features that are already documented in the Firefly Online Help. Links to specific online help articles within the table's user interface are noted with the info icon (![]() ). In the following example, the Table Options pop-up links to its corresponding Firefly online help article in the lower-right corner.
). In the following example, the Table Options pop-up links to its corresponding Firefly online help article in the lower-right corner.

You have the option of customizing each panel's display by clicking the Edit Table Options button  in the upper-right corner of each panel.
Panel 1: Viewing and Filtering Spectra
Panel 1 (upper-left) displays all available spectra in the Exoplanet Archive. From this panel, you can filter and sort spectra by their parameters, such as by planet, instrument, or wavelength range.
Note that filtering inputs are case-insensitive, so JWST and jwst are interpreted the same. The service automatically wraps the query text in wild card characters (i.e., adding like '% %') so it's not necessary to include them.
In the following example, we'll filter the table to show only transmission spectra taken by JWST between 1.0 and 6.0 microns:
- Go to https://exoplanetarchive.ipac.caltech.edu/cgi-bin/atmospheres/nph-firefly?atmospheres and load the table.
- First, we will filter by Facility: enter jwst in the text box directly under the Facility column heading. Note: The Facility column may be offscreen; move the panel's bottom scroll bar to the right to bring the column into view.
- Tap Enter or Return to view the filtered results.
- Next, we'll filter the Type of Spectrum column: enter transmission under Type of Spectrum.
- Tap Enter or Return to view the filtered results.
- Finally, we'll filter the results by wavelength. Enter >1.0 under Min. Wavelength and <6.0 for Max. Wavelength.
- Tap Enter or Return to view the filtered results.
Your results may differ from those in the following screenshot because new spectra are regularly added to the archive. However, you should see some of the following results:
Click to view a larger image in a new window:
Panel 1: Downloading Data
There are two types of data you may download from panel 1: spectral data and metadata. Spectral data include the datapoints for each spectrum; metadata are the same information displayed in panel 1, such as Planet Name, Type of Spectrum, Reference, Instrument, etc.
Option 1: Download spectra with a wget script.
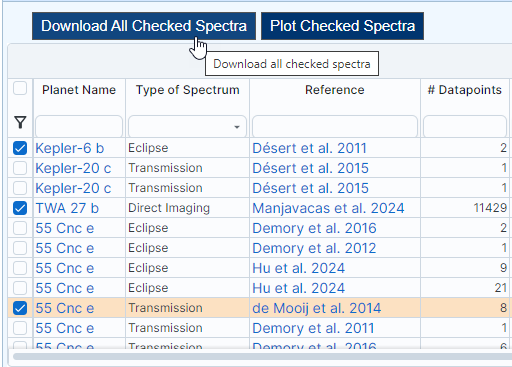
Once you've filtered the list in panel 1 to display only your desired spectra, you can download them by either clicking the checkbox above the funnel icon to select all filtered results, or click the corresponding checkbox for each spectrum and then click Download All Checked Spectra in the top-left.
Your web browser will open a new tab and display a wget script in plain text to retrieve each spectrum, which you may copy and paste into a terminal window to download the spectra. Each script begins with wget and ends with a file name with the file extension .tbl.
More information about installing and using the wget utility to download files is in IRSA's wget documentation.

Option 2: Download the metadata.
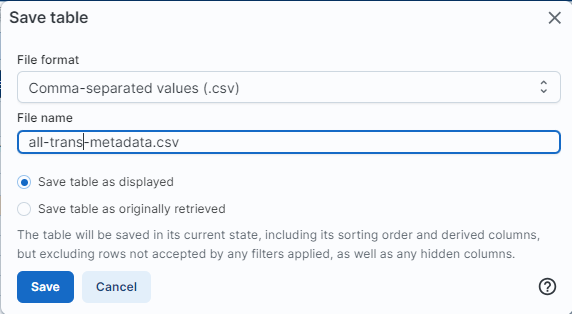
The Save the Table button (![]() ) in the upper-right corner of panel 1 allows you to download the metadata displayed in panel 1 (i.e., the metadata—not the actual spectra).
) in the upper-right corner of panel 1 allows you to download the metadata displayed in panel 1 (i.e., the metadata—not the actual spectra).
When the button is clicked, the Save table pop-up box appears and you may specify the file format and file name of the downloaded file. The default file format is IPAC Table Format (.tbl); other options are: comma-separated values (.csv), tab-separated values (.tsv), VOTable - TABLEDATA (.vot), VOTable - BINARY2 (.vot), and VOT - FITS (.vot).
Then, select one of the radio buttons:
- Select the top button if you have filtered the metadata in panel 1 and want to download the filtered results.
- Select the bottom button if you want a file of all metadata listed in the panel 1 (unfiltered).
- Single-plot Mode (default), in which a single spectrum that is highlighted in panel 1 is plotted in panel 3, or
- Multi-plot Mode, where up to 40 individual spectra are overplotted in panel 3.
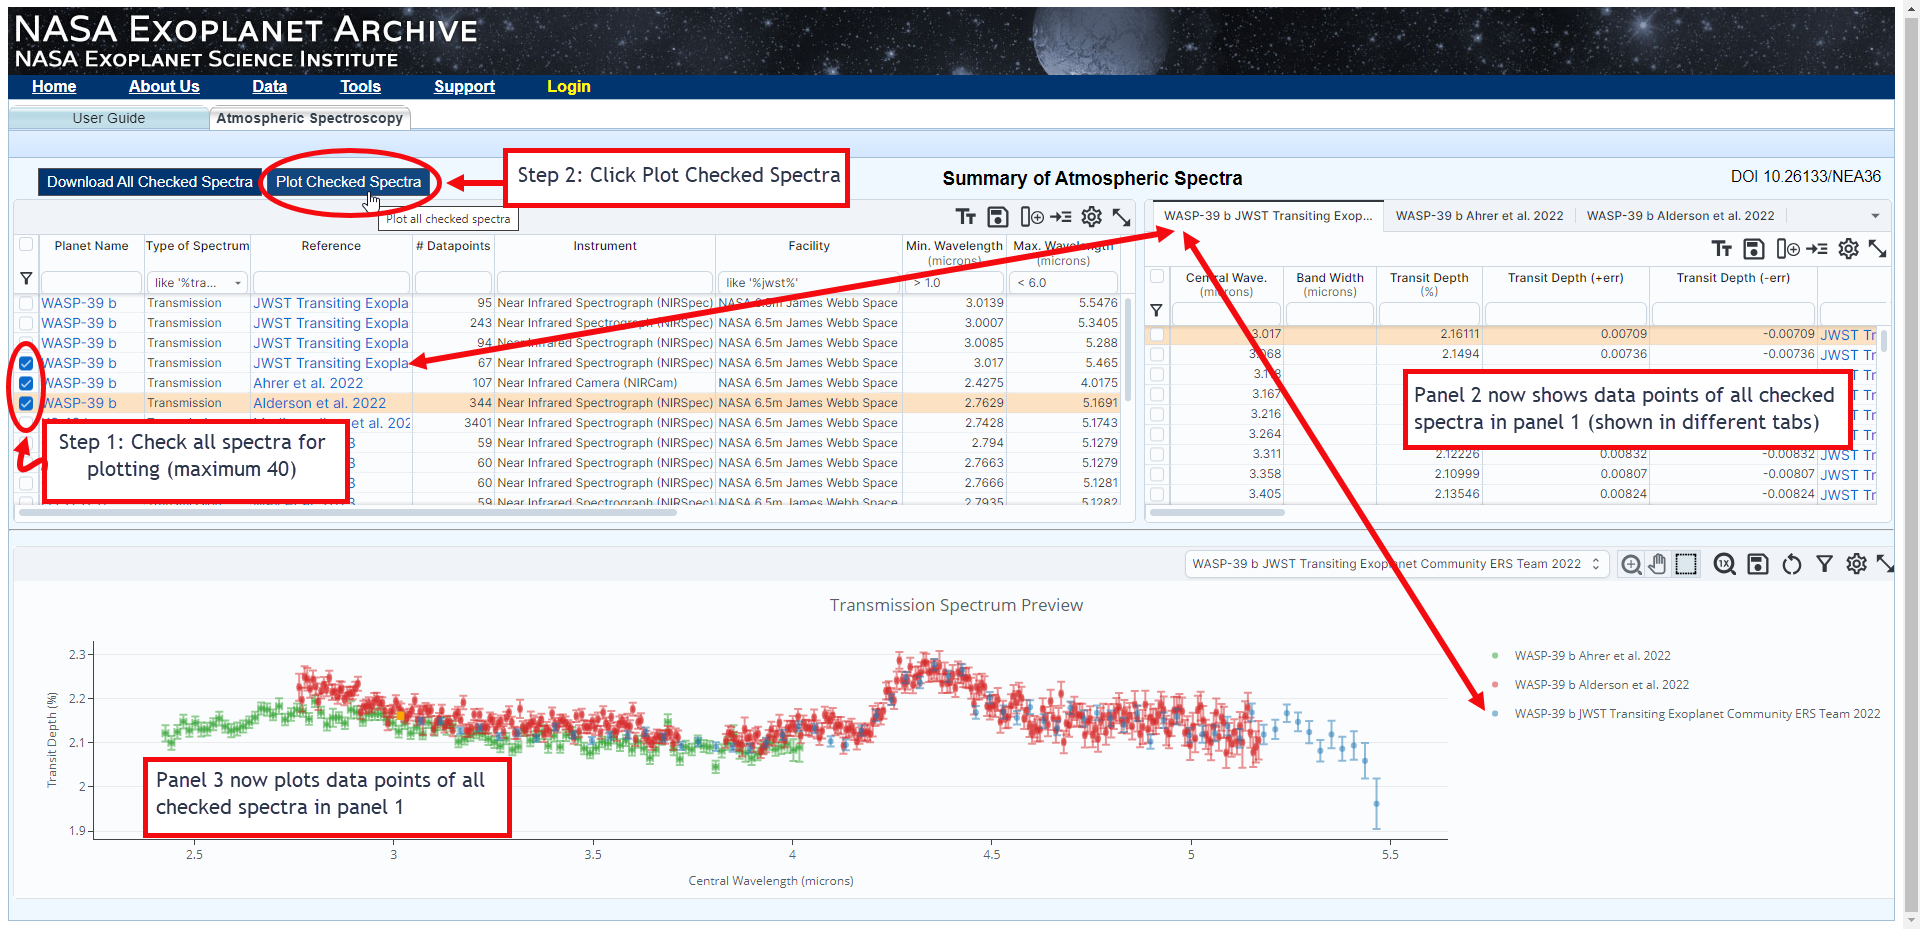
- In panel 1, check the boxes for your desired spectra. For plotting purposes, all spectra selections must be the same type (i.e., all Direct Imaging, all Eclipse, or all Transmission).
- Click the Plot Checked Spectra button, which toggles the service into Multi-plot Mode. Data points for each selected spectrum are displayed in panel 2 on their own tab, each of which is labeled with the spectrum's corresponding Planet Name and Reference.
- In panel 3, the data points for each plotted spectrum are displayed in a different color.
Use the legend on the right side of the plot to determine which colored plot point corresponds to which spectrum. You may also click on a spectrum name in the legend to show or hide that data from plot; its legend entry is grayed out when hidden.
The data for all of the overplotted spectra will also be visible in panel 2, in multiple tabs (one tab per spectrum).
- From here, you can analyze your plotted spectra using the controls in the upper-right corner; these include zoom, pan, select (a range of points), reset magnification, image download, chart reset, define filters, plot parameters, and maximize plot view. More information on using each control is documented in the Firefly online help.
- To exit Multi-plot Mode and return to viewing a single spectrum in Single-plot Mode, simply click on a different spectrum in panel 1. All of the tabs in panel 2 and overplotted spectra in panel 3 will be replaced with the single, highlighted spectrum.
Click Save to generate and download the text file to your machine.
In the following example, we are downloading all transmission spectra metadata currently available through the Atmospheric Spectroscopy Table into a .csv file called all-trans-metadata.csv.

Panel 2: Analyzing Spectra Data Points
This panel displays the data points associated with the spectrum highlighted (but not necessarily checkmarked) in panel 1. For descriptions of the spectral data columns, see the Data Column Definitions page of this user guide.
IMPORTANT: The data columns in panel 2 are specific to either direct imaging, eclipse, or transmission spectra, depending on the type of spectrum highlighted in panel 1.
Panel 3: Plotting Multiple Spectra
The table's plotting feature offers two plotting modes:
Single-plot Mode is the table's default mode. To plot an individual spectrum, click on its row in panel 1 to highlight it; its data points will display in panel 2 and be plotted in panel 3.
To overplot two or more spectra in Multi-plot Mode:
Click to view a larger image in a new window

«Previous Getting Oriented with the Table Interface Spectroscopy Calculations Next »
Last updated: 14 August 2024
