Spectroscopy Calculations
User Guide
So that all of the spectra in the Atmospheric Spectroscopy Table can be uniformly presented and compared, we convert and provide calculated values based on the few most common ways that transmission or directly imaged spectra are presented. Our goal in providing the calculated parameters is for ease of spectral comparison within the atmosphere environment and not for scientific output.
Panel 2 (upper-right corner) of the Atmospheric Spectroscopy Table has a provenance column associated with each measured value, such as transit depth or radius ratio, and reports which parameters appear in the publication and which are calculated.
If the parameter was reported in the publication, the provenance column shows a link to the publication, whereas if the parameter was calculated, the provenance column says Calculated Value and links to this page.
NOTE: Users who wish to perform any scientific analysis on the data (e.g., retrievals, model fitting to spectra, etc.) should use the parameter reported in the publication and not calculated parameters, whenever possible.
Skip to a section:
Transmission Values Conversion
Direct Imaging Values Conversion
How the Archive Converts Transmission Values
Transmission spectra can be reported in three different ways:
- Transit Depth: reported as a percentage
- Ratio of planet to stellar radius (Rp/Rs): reported as a unitless number
- Planet radius (Rp): in units of Jupiter radii
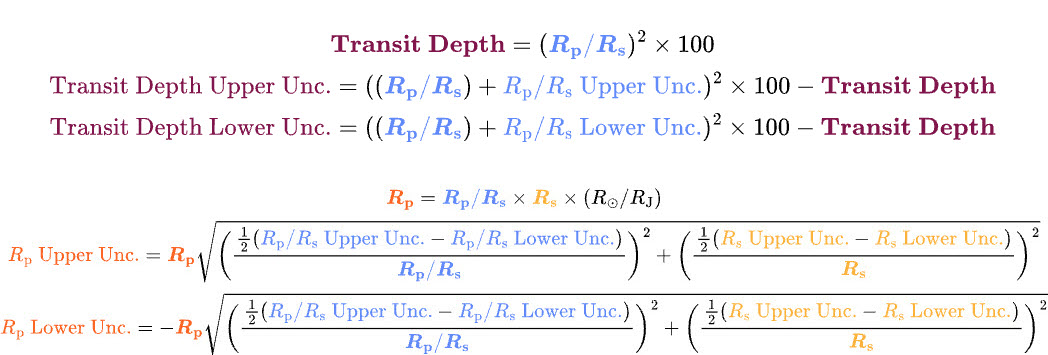
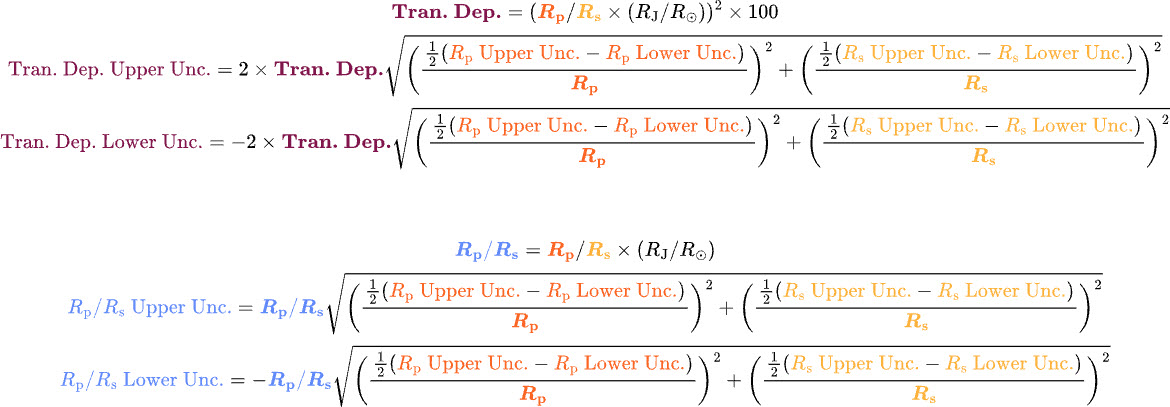
Here, we describe the underlying logic and formulae used to generate the table. Each of these three values is a separate column in the transmission spectra files and have their own associated uncertainties. We have colored each column a different color and use bolded font to represent the column values and unbolded font of the same color to represent the uncertainties. If the paper reports any of the three parameters with different units, we convert to the above-stated units first.
If the publication reports the Transit Depth:

If the publication reports ratio of planet to stellar radius (Rp/Rs):

If the publication reports planet radius (Rp):

If the transit depth is negative, we will report the calculated value for the ratio of planet to stellar radius (Rp/Rs) and the associated uncertainties (Rp/Rs Upper Unc. and Rp/Rs Lower Unc.) as NaNs. If the absolute value of the transit depth lower uncertainty is larger than the transit depth, we will report the Rp/Rs lower uncertainty as a NaN.

All of the calculations involving planet radii require a value for the exoplanet host's stellar radius (Rs), which is always assumed to have units of solar radii. If a value is provided in the publication, we use that value. If no value for the host's stellar radius is given in the publication, we use the default stellar radius from the Planetary Systems Composite Table. In each case, the stellar radius, uncertainties in the stellar radius, and the publication where the stellar radius is reported (stellar radius provenance) are displayed as columns in the transmission spectra files. Since these values are also separate columns, we have chosen a different color and use the same bolding convention as the other columns.
† The ratio of Jupiter radii to solar radii is a constant, which is calculated using the nominal solar radius from the IAU list of definitions (6.957 × 10^8 m) and the equatorial Jupiter radius at one bar (7.1492 × 10^7 m).
How the Archive Converts Direct Imaging Values
Direct Imaging spectra are often reported in two different ways:
- F_lambda (Fλ) : Flux density per unit wavelength in units of W/m2/micron
- F_nu (Fν): Flux density per unit frequency in Janskys (Jy)
Each of these values is a separate column in the direct imaging spectra files, and have their own associated uncertainties. As in the documentation above, we have colored each column a different color and use bolded font to represent the column values and unbolded font of the same color to represent the uncertainties. So that all of the spectra in our table can be uniformly presented and compared, we fill in the missing parameters from whichever one is reported in each publication. If the paper reports any of the parameters with different units (e.g., mJy) we convert to the above stated units (e.g., Jy) first.
- If the publication reports Fλ:

- If the publication reports Fν:

These calculations use the central wavelength values that are given in the column central wave. for each data point.
‡ denotes the speed of light (2.998×10⁸ m/s)
«Previous Viewing, Filtering, Downloading, and Plotting Spectra Data Column Definitions Next »
Last updated: 14 August 2024