Getting Oriented with the Table Interface
User Guide
- About the Atmospheric Spectroscopy Table
- Getting Oriented with the Table Interface
- Viewing, Filtering, Downloading, and Plotting Spectra
- Spectroscopy Calculations
- Data Column Definitions
- Tips and Troubleshooting
Layout Overview
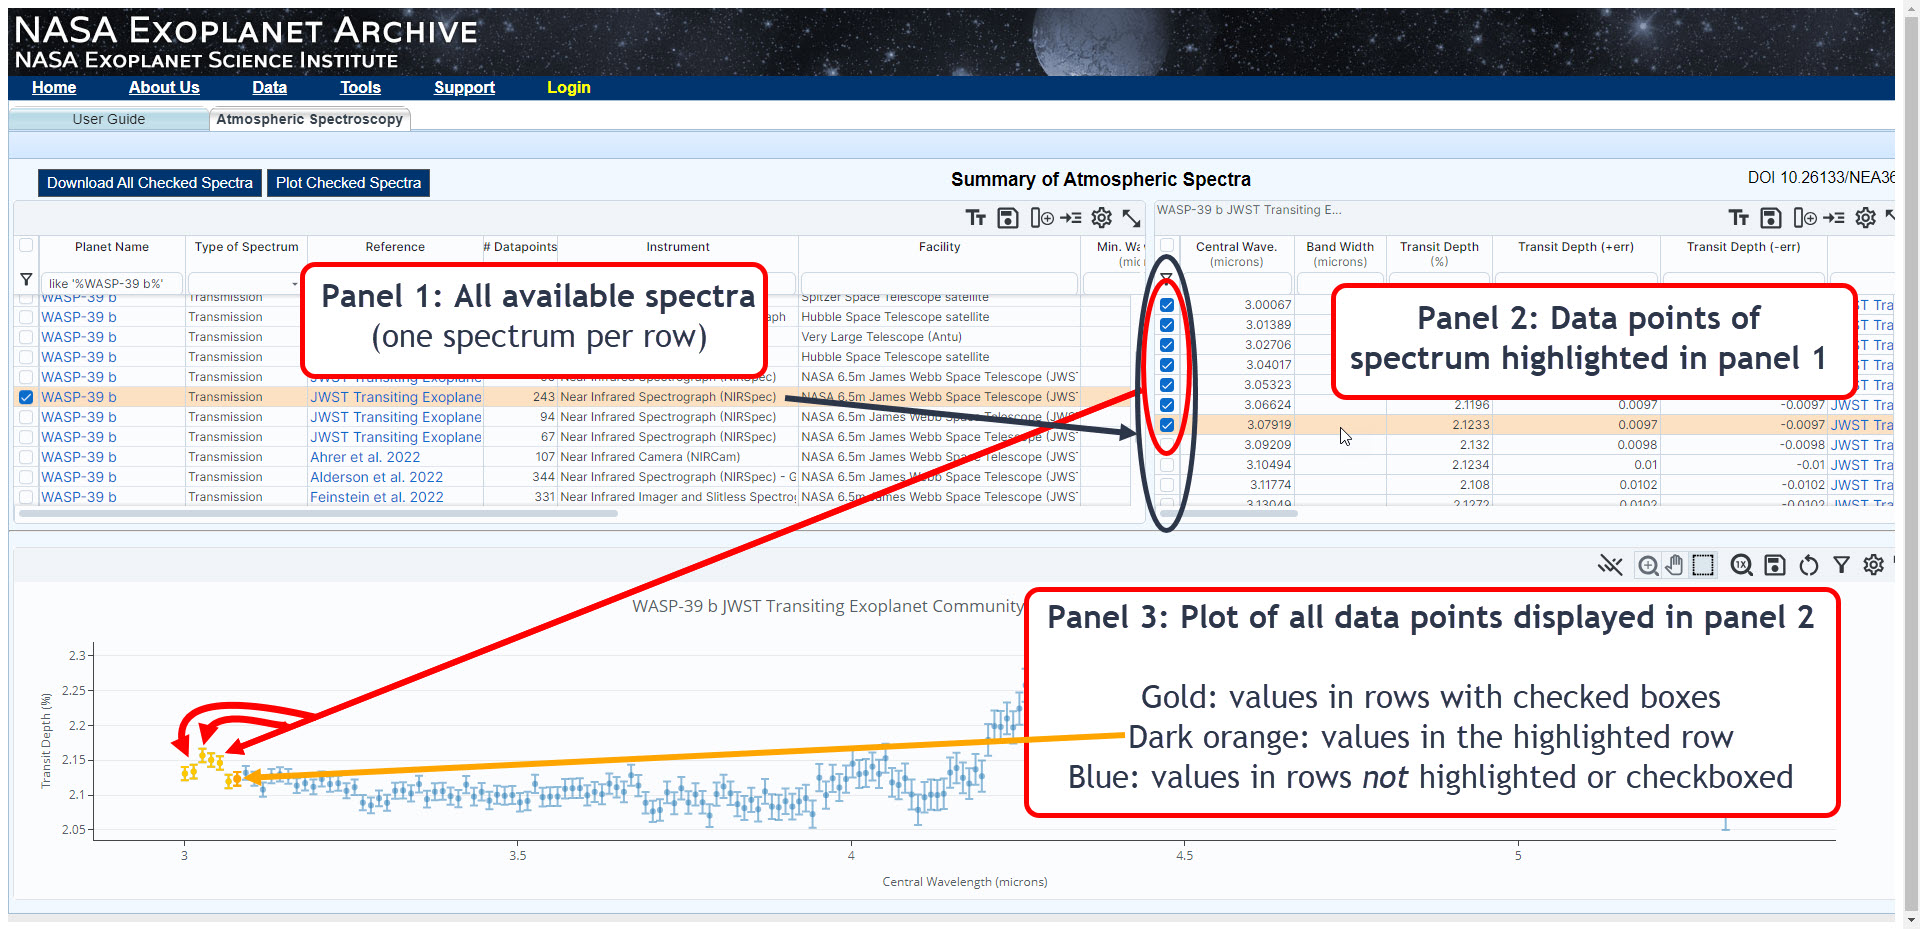
The Atmospheric Spectroscopy Table is composed of three panels:
- Upper-left (panel 1): Lists all spectral data in the archive, one row per spectrum.
- Upper-right (panel 2): Either displays all data points associated with a single spectrum that is highlighted in panel 1 (Single-plot Mode), or displays multiple spectra selected in panel 1 in a tabbed format (Multi-plot Mode).
- Bottom (panel 3): Displays a plot of the selected spectra
Click to view a larger image in a new window

Atmosphere Panels
Panel 1: Spectra
The upper-left panel lists all of the available spectral data in the Exoplanet Archive. Each table row displays one spectrum and its metadata, such as Facility, Instrument, or Min./Max. Wavelength.
In this panel, you can:
- Highlight a spectrum to view its data points in panel 2 (upper-right panel) by clicking anywhere in the row that is not a blue link.
- Select individual spectra to view the wget script, which you can then copy and paste into a terminal window and download the spectra.
- Filter the table by its metadata to find a specific spectrum or spectra.
Instructions for completing the above tasks are provided on the Viewing, Filtering, Downloading, and Plotting Spectra page.
Panel 2: Data Points
This panel displays all of the data points for the spectrum highlighted in panel 1, which is indicated when the spectrum's row is a different color than the rest of the rows. To highlight a row, click anywhere in the row that isn't a link (i.e., underlined blue text). Checking the box in the first column of the table also highlights the row, however, it's important to note that the purpose of using checkboxes is to select spectra for download or multi-plotting.
IMPORTANT: A spectrum in a highlighted row in panel 1 is displayed in panel 2, regardless of whether the spectrum's checkbox is checked.
Panel 3: Data Points Plot
This panel displays a plot all of the data points of the spectrum highlighted in panel 1 in Single-plot Mode, or an overplot of all selected spectra when Multi-plot Mode is activated by clicking the Plot Checked Spectra button. In Multi-plot Mode, multiple spectra can be selected and overplotted so that spectra of the same planet from different instruments, or spectra of different planets, can be directly compared.
«Previous About the Atmospheric Spectroscopy Table Viewing, Filtering, Downloading, and Plotting Spectra Next »
Last updated: 15 August 2024