Settings and Parameters
User Guide
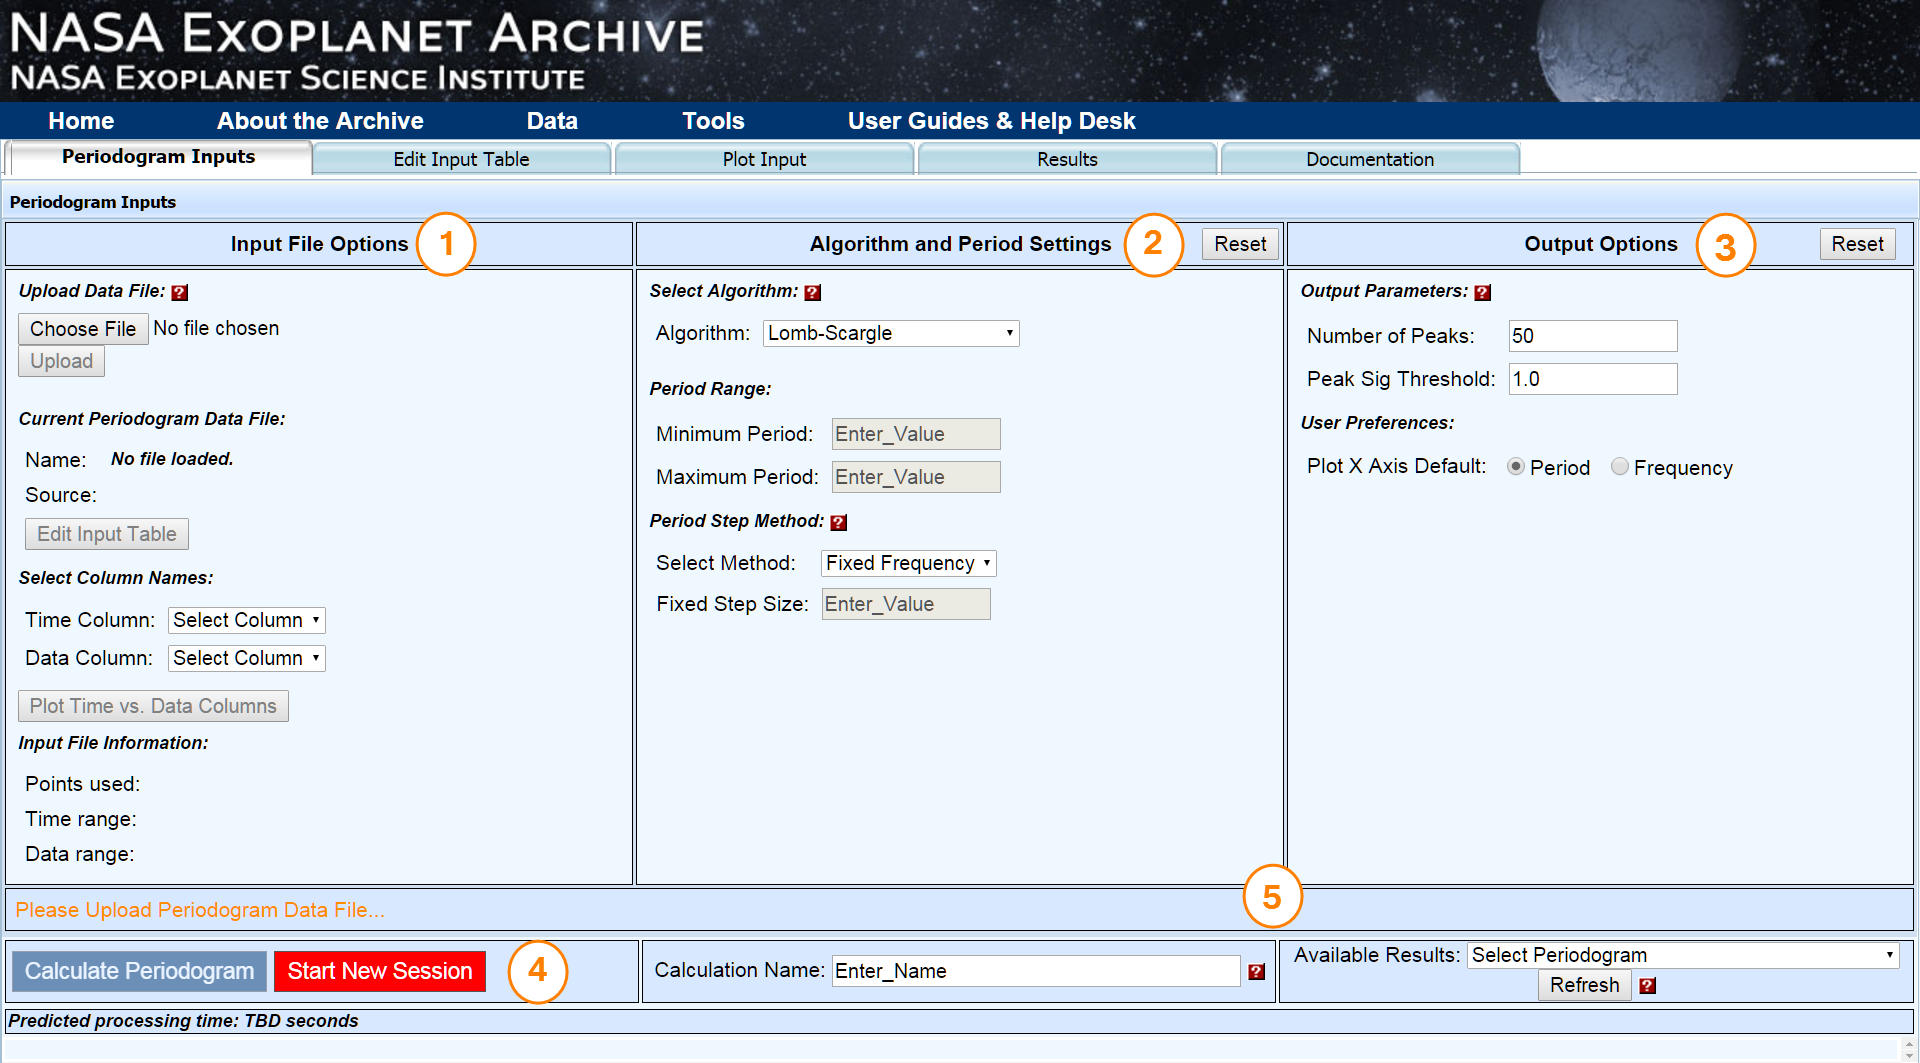
Using the Service:This page describes the functions and settings of the Periodogram service's interface. For more information and help using the Periodogram service, click any of the links in the Documentation box on this page.
Skip to a section:
Input File OptionsAlgorithm and Period Settings
Output Parameters
Results Tab Parameters
Printer-friendly version
Click for larger image
Input File Options 
Upload Data File
The file name of the time series loaded from either your input file or the Archive's Kepler light curve viewer is listed here.
Note: Make sure you click Upload after selecting the file.
Edit Input Table
Click this button to load your input data to the Edit Input Table tab, where you may then filter it using the interactive table interface before calculating a periodogram.
Select Column Names
After uploading your input file, specify the name of the column containing the time and data values. Click Plot Time vs. Data Columns to preview the plot on the Plot Input tab.
Algorithm and Period Settings 
Some settings are algorithm-specific and are listed below as (LS), (BLS), and (Plavchan).
Select Algorithm (all algorithms)
Specify Lomb-Scargle, Box-fitting Least Squares or the Plavchan algorithm. The default is Lomb-Scargle.
- Lomb-Scargle is an approximation of the Fourier Transform for unevenly spaced time sampling. It identifies periodic signals that are simple combinations of sines and cosines (sinusoids). This is the default value.
- Box-fitting Least Squares (BLS) is optimized to detect periodic transits by fitting the time-series to a repeating box-shaped curve. A "box" is the addition of two step functions with opposite sign and equal amplitude separated by some finite time.
- Plavchan is an algorithm that identifies periods with coherent phased time-series curves (i.e., smoothest). There is no assumption about the underlying shape of the periodic signal with this approach.
For in-depth information on the algorithms used by the Periodogram function, see the Algorithms documentation.
Period Range (all algorithms)
If no values are entered, the defaults are derived from the median time step in the input data and the overall time span covered. Note that values may be input in exponential notation, e.g. "2e4".
- Mininum - Specify the minimum period for which to compute a periodogram power. If no value is input, twice the the median time step in the data is used. This is approximately the Nyquist sampling frequency limit.
- Maximum - Specify the maximum period for which to compute power. If a value is not input, the time span baseline covered in the data is used.
Period Step Method (all algorithms)
During periodogram computation, the power is calculated for a set of candidate periods. There are several ways to select this set of periods. Each method will restrict the sampled periods within the input period range in a different way.
You may specify the method to use for selecting the periods at which to calculate the periodogram power. The default is Exponential.
-
Fixed Frequency (Fixed df) - In this method, frequencies are chosen at evenly spaced intervals between the specified minimum and maximum frequencies based on the value of the Fixed Step Size. These are transformed into periods using the relationship period = 1/frequency. This method has the advantage of sampling the frequency range evenly, but may result in additional processing time if a small value is chosen for the Fixed Step Size. The default Fixed Step Size is described below.
-
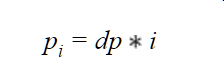
Fixed Period (Fixed dp)- In this method, periods are chosen at evenly spaced intervals between the specified minimum and maximum periods based on the value of the Fixed Step Size. This method has the advantage of evenly sampling the period range evenly, but may result in additional processing time if a small value is chosen for the Fixed Step Size.
-
Exponential - In this period step method, periods will be chosen as
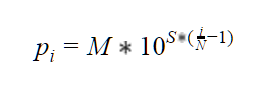
where
M= Period Range Maximum,m= Period Range Minimum andSis defined as: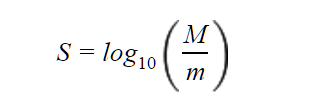
-
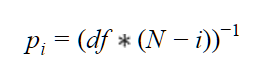
Plavchan This method chooses between Period Range Minimum and Period Range Maximum according to
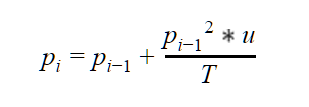
where T is the time span baseline and u is the Period Step Factor.
In summary:
| df | step size in frequency space |
| dp | step size in period space |
| p(i) | output period value |
Note that the number of points sampled depends on the Period Range Minimum and the Period Step Factor. The p2 term leads to rather small increments for p < 1 days, so you may wish to specify Period Range Minimum > 0.5 days when using this method to avoid excessive computation time spent on extremely small periods.
Fixed Step Size (all algorithms)
This quantity is the fixed amount by which the frequency or period will be incremented for period sampling. If this quantity is not specified and one of the fixed step methods is selected, the default value will be (max-min)/(number of periods to sample). Number of periods to sample is calculated as number of datapoints x 10. This parameter is associated with the Fixed df or Fixed dp period step methods, and does not need to be specified when other methods are used.
Number of Outliers (Plavchan)
This parameter allows adjustment of the Plavchan power calculation. When comparing the time-series to the dynamical prior, computation may be restricted to the N worst-fitting data points. The worst-fit data points may change for different candidate periods, as the prior also changes. This improves sensitivity in low signal-to-noise searches.
Period Step Factor (all algorithms)
This factor controls the size of the period step in the Plavchan period step method (not to be confused with the Plavchan algorithm). Typically, coarse stepping is 0.1, fine is 0.01, and ultra-fine is 0.001.
Phase Smoothing Box Size (Plavchan)
The Phase Smoothing Box parameter specifies the width of the phase box over which to average the time-series data to compute the dynamical prior. A value of 0.05 is typical for ground-based transit surveys with a few thousand data points. The default is 0.06.
Oversample Factor (all algorithms)
This value specifies the factor by which the number of data points is multiplied to produce the target number of periods sampled. In some cases, data have been binned before processing. The Oversample Factor parameter can compensate for this reduction in the number of data points. This factor may not be modified by the user in conjunction with the Fixed Step Size parameter or the Plavchan Period step method. In those cases, the default value of 10 is used.
Number of Bins (BLS)
Use this parameter to specify the number of bins. The BLS algorithm relies on binning data points and the number of bins may be specified as an input parameter. The goal is to choose the number of bins to achieve a balance between having a reasonable number of points in each bin and partitioning the phase interval into a reasonable number of pieces. "Reasonable" in each case will depend on the number of points in your light curve. Typical applications of the BLS algorithm for ground-based transit surveys use ~50 bins.
Fraction of Period in Transit (BLS)
The BLS algorithm hypothesizes that some fraction of the period will be spent in the "low" state and the remainder in the "high" state. You may specify the minimum and maximum allowable fraction of the period spent in the low state. The BLS algorithm will search for “low states” (e.g., transits) over this range of fractional durations.
- Min - Specify the minimum fraction of period.
- Max - Specify the maximum fraction of period.
Output Parameters 
Number of Peaks to Return
This option sets the maximum number of periodogram peaks to identify and return. A Table of Peaks will be displayed as part of the periodogram service output. Note that no peaks will be returned if their p-values* (see below) are not below the Peak Significance Threshold. The default value is 50.
Note: Peaks are identified in decreasing significance order from the maximum periodogram power value. If a subsequent power value is within the width of a larger peak (e.g., part of the same single peak), it is ignored in this output list. The peak width is defined as the period range over which the periodogram power values fall off from the local maximum value back to the mean power value.
Plot X Axis Default
Choose either Period or Frequency.
Peak Sig Threshold (P-Value)
This threshold limits the returned output peaks to those with a probability of chance occurrence (p-value) less than the value specified. This probability is based on the number of periods sampled and the assumed background distribution of periodogram power values for the algorithm (see Algorithms for more information). The default is 1.0, so no peaks will be filtered unless a threshold is explicitly set.
Calculations and Sessions 

Calculate Periodogram
Click to run the periodogram with the data and settings you have specified. The periododgram displays on the Results tab, but you can return to the Periodogram Inputs tab to modify the settings and re-run the calculation.
Start New Session
Clicking the Start New Session button resets the service and all previously entered data so you can run a new calculation. Note that you may recall recent results from the Available Results drop-down menu.
Calculation Name
When running multiple periodogram calculations, you may opt to re-label the calculation for future reference, especially when running multiple calculations on the same input data with different settings. By default, periodogram sessions are named after the input file and preceded with a timestamp.
Available Results
This is a recent history of your periodogram calculations. Results are retained for three days if cookies are enabled on your web browser. Clicking Refresh loads calculations that may be displayed in other web browser tabs if you are running concurrent calculations.
Results Tab Parameters
Table of Peaks
This threshold limits the returned output peaks to those with a probability of chance occurrence (p-value) less than the value specified. This probability is based on the number of periods sampled and the assumed background distribution of periodogram power values for the algorithm (see Algorithms for more information). The default is 1.0, so no peaks will be filtered unless a threshold is explicitly set.
Click the Download link to download an ASCII text file of the table.
Enter Different Period for Phase Curve
Enter a numeric value to specify your own period if it is not listed in the Table of Peaks.
Last update: 26 April 2018