Using the Periodogram Service
User Guide
Using the Service:Printer-friendly version
For some use cases that demonstrate how to use the service, see the recipes for examining variable star data and analyzing the evolution of star spots on a star with a confirmed, short-period planet.
Accessing the Service
The Periodogram service calculates data from light curves served by the Archive, and also accepts input files uploaded by users. The service can be accessed any of the following ways:
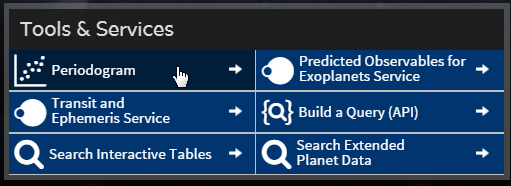
- From the Periodogram Service: Click the Periodogram button on the Exoplanet Archive home page:
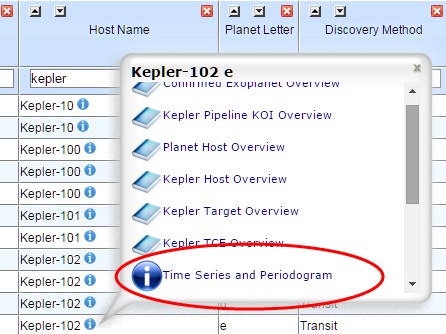
- From an interactive table pop-up bubble: Double-click the
 info icon for a planet in one of the interactive tables that contains objects with light curves, such as the Confirmed Planets table, KELT, K2 Targets, or the SuperWASP table. Find and click the Time Series and Periodogram link in the pop-up bubble. The following example is from the K2 Targets table:
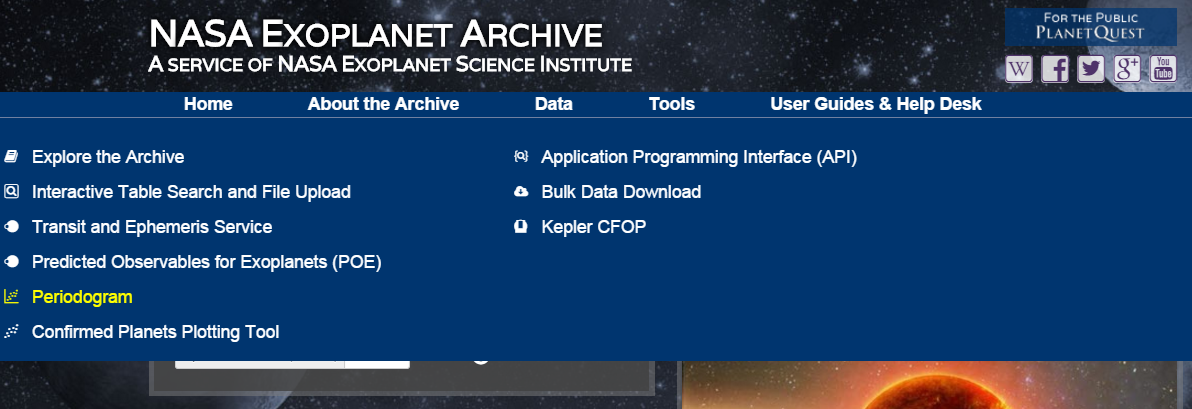
- From the archive navigation menu: Mouse over Tools in the menu bar and select Periodogram from the pull-down menu:
Input File Formatting Rules
If you are uploading your own input file (rather than accessing the Periodogram through the Archive's Kepler Light Curves data set), please see the file formatting rules to ensure your input file is accepted.
Editing an Input Table
Note about Default Filtering: Previously, the Periodogram service filtered values based on the data source extracted from the header information. This filtering could not be controlled by the user. In the new interface, all filtering is performed explicitly by the user—before the file is uploaded, by using the interactive table, or by designating a null value in the header.
Before initiating a periodogram calculation, you can use the interactive table on the Edit Input Table tab to filter which data to include in the calculation by entering a constraint in the text boxes above the columns (e.g. Magnitude <13.5)
Note that the Periodogram's interactive table is very similar to the kind used with other data sets in the Archive, however, some of the table's features are not necessary for the Periodogram, and therefore not available.
To use the Periodogram's interactive table:
- On the Periodogram Inputs tab, click Choose File to select an input data file.
- Click Upload.
- Click the Edit Input Table button to load the input file data onto the Edit Input Table tab for filtering. You may also go directly to the Edit Input Table tab and load the data from there.
- On the Edit Input Table tab, filter and sort the data as needed. For a primer on sorting and filtering, see the relevant section of the Interactive Table User's Guide.
- Filter the data as needed (note this is an optional step). If you added filters and then decided not to apply them, simply click the Reset Filters button in the lower-right corner of the page to remove them.
- Return to the Periodogram Inputs tab to update Algorithm and Parameter Settings and Output Options (if necessary), then click Calculate Periodogram.
Note: Input files with more than 100,000 lines cannot be filtered and the checkboxes to the left of each row have no effect on the calculation. Also, any filters applied are reflected in the input file information reported.
Plotting an Input Table
Plotting an input file is useful because it provides a quick preview of your plotted data before submitting a periodogram calculation.
Settings and Parameters
Once your data file is uploaded, the Periodogram service updates its default values based on the input file. You may modify these settings in the Algorithm and Period Settings and Output Options panes on the Periodogram Inputs tab. See the Algorithms and Parameters documentation for details on each setting.
Note about New Minimum Period: The minimum period was previously set to 0.04 days. This minimized the calculation time, but did not allow full examination of the periods for high cadence data, particularly Kepler short cadence data. The new minimum value is 0.0003 days.
Viewing Current Results
After clicking the Calculate Periodogram button on the Periodogram Inputs (or Results) tab, the service will take some time to process your request. Depending on the size of your input file, it may take a few minutes (or more). Longer calculations will be sent to a background service manager where you can choose to be notified by email when the job completes.
The periodogram result displays on the Results tab where you may do further analysis, or you may return to the Periodogram Inputs tab to refine the parameters and settings and re-submit the job.
Viewing Past Results
The service retains the results from your most recent periodogram calculations, which are listed in the Available Calculations pull-down menu on the Periodogram Inputs tab. If you are running concurrent calculations on other tabs of the same web browser, click the Refresh button next to the Available Results pull-down menu to load the other results into the current list.
The default name for each result is the input file name, preceded by a timestamp. If you are running several different calculations from the same input file(s), it's advisable to name each calculation by entering it in the Calculation Name field before clicking Calculate Periodogram.
Results are stored for four days, unless your web browser cache and cookies are reset.
Last update: 26 April 2018