The Q1–Q17 Data Release 25 (DR 25) Kepler light curves were searched for periodic flux decrements consistent with the signals produced by transiting exoplanets, known as Threshold Crossing Events (TCEs, Twicken et al. 2016). These TCEs were then evaluated by an algorithm called the Robovetter, which is an automated vetting program designed to mimic the human decision-making process employed for previous catalogs. This Robovetter is trained against known false positives and known transit-like signals to optimally balance the completeness and reliability of the catalog. The Robovetter first determines if a TCE is transit-like or not. If it is transit-like, the TCE is assigned a KOI number and shown in the Q1–Q17 DR 25 KOI activity table. Each KOI is further searched for evidence of being an eclipsing binary (e.g., having a secondary eclipse, ellipsoidal variations, or deep, V-shaped eclipse), as well as evidence of a centroid offset or ephemeris match, which indicate that the transit-like signal does not originate from the target. For each KOI, a disposition of CANDIDATE or FALSE POSITIVE is given, as well as a number of major and minor flags to document the Robovetter's decision-making process. The catalog uses the stellar parameters for the observed Kepler targets found in the Q1–Q17 DR 25 stellar table, described by Mathur & Huber (2016) and Mathur et al. (2017). For each KOI, the Q1–Q17 DR 25 Kepler flux time series data are fit by a Mandel & Agol (2002) transit model, and a Markov Chain Monte Carlo (MCMC) routine is used to obtain accurate uncertainties on the fitted parameters (see Rowe et al. 2014 and Rowe and Thompson 2015).
Note that only KOIs detected as TCEs in the Q1–Q17 DR 25 run of the Kepler Pipeline are included in the Q1–Q17 DR 25 KOI table. If a previously known KOI was not found by the Q1–Q17 DR 25 Kepler Pipeline, it is not included in the Q1–Q17 DR 25 KOI table.
More details about this catalog, the vetting procedures, and the candidates it contains will be published in Thompson et al. (2018).
The Kepler Pipeline (release SOC 9.3) was run on the Q1–Q17 DR 25 light curves to search for TCEs (Twicken et al. 2016). All TCEs found by this Pipeline run are available in the Q1–Q17 DR 25 TCE table. For the Q1–Q17 DR 25 Pipeline run, a total of 34,032 TCEs were generated. This number includes both genuine TCEs and 1498 rogue TCEs. Rogue TCEs were discovered after the TCE table was created. An error in the transit planet search (TPS) module of the Kepler Pipeline allowed some illegitimate three-transit TCEs to be created. Because these TCEs are not modeled by the occurrence rate products which characterize the TPS module, they should not be included in occurrence rate calculations using these products. The "rogue" TCEs are flagged in the TCE table with the column tce_rogue_flag = 1 and only the set of 32,534 legitimate TCEs were used to create the Q1–Q17 DR 25 KOI catalog (i.e., the rogue TCEs are ignored).
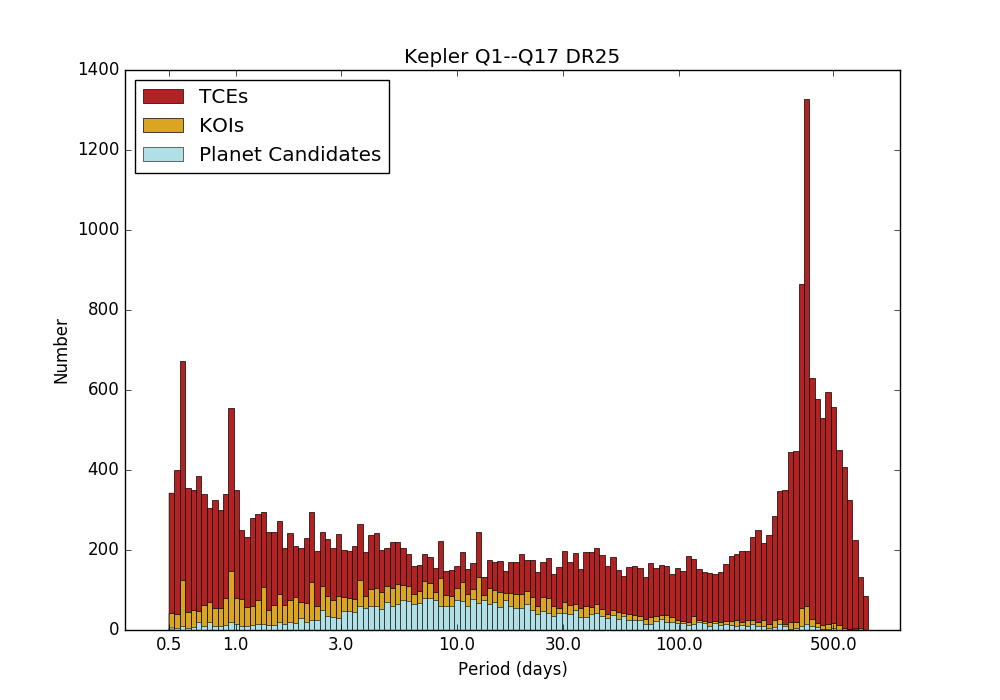
As can be seen in the figure below, a majority of the genuine TCEs are not valid planet candidates — there is a large excess of not transit-like TCEs at both short and long periods due to astrophysical variability (e.g., rapid rotators with strong starspots, eclipsing binaries, pulsating stars) as well as uncorrected instrumental artifacts (e.g., rolling-band noise, cosmic rays, flares, thermally induced variations, and data processing artifacts). The large spike in the histogram near the approximate orbital period of the spacecraft (372 days) is primarily caused by targets that fall on CCD channels known to produce strong instrumental artifacts and rolling bands (see The Kepler Instrument Handbook Section 6.7.1) for at least one season during the Kepler spacecraft year. Narrow spikes at shorter periods result from flux contamination by bright variable stars (e.g., RR Lyrae, V2083 Cyg, BR Cyg), as well as systematic events common to multiple detectors.
Minor flags provide more specific information on decisions and can be found in the KOI table's comment field, with the meaning of each minor flag described on the data column description page.
The TCEs from the Q1–Q17 DR 25 search were federated with pre-existing KOIs, and their latest dispositions are given in the Q1–Q17 DR 25 KOI table. Transit-like TCEs that did not federate with any previously designated KOI were assigned new KOI numbers and their dispositions are given in the Q1–Q17 DR 25 KOI table. Pre-existing KOIs that did not federate with Q1–Q17 DR 25 TCEs are not shown in the Q1–Q17 DR 25 KOI table. Note that some new KOIs were designated while the Robovetter was actively being developed, and thus some new KOIs are ultimately dispositioned as not transit-like FPs. Also, some not transit-like FPs that are marginal fails are made into KOIs to facilitate occurrence rate studies (see Disposition Scores in the next paragraph). Note that any Q1–Q17 DR 25 TCE that does not have a corresponding KOI in the Q1–Q17 DR 25 KOI table can be assumed to be dispositioned as a not transit-like FP (unless the TCE is a "rogue" TCE).
The Disposition Score column (koi_score) is new to the Q1–Q17 DR 25 KOI table. The score has a value between 0 and 1. For CANDIDATEs, a higher value indicates more confidence in its disposition. For FALSE POSITIVEs, a higher value indicates less confidence in its disposition. The score is calculated for each TCE using a Monte Carlo technique that randomly perturbs each Robovetter metric from its nominal value and re-dispositions the TCE 10,000 times. The amount of the perturbation is based on the asymmetric median absolute deviation of each metric's intrinsic scatter as a function of period and MES in the population of on-target, pixel-level, planet injections (Christiansen et al., in prep). The reported score is simply the fraction of iterations that result in a disposition of CANDIDATE for that KOI. For example, if a CANDIDATE KOI has a few metrics that are near the Robovetter's thresholds, it will frequently have at least one that is perturbed across a threshold. As a result, many of the iterations will produce a false positive and the candidate will have a low score. Similarly, if a FALSE POSITIVE KOI barely fails a single metric, the score may be near 0.5, indicating that it was deemed a planet candidate in half of the iterations. Only about 0.6 percent of FALSE POSITIVE TCEs have scores greater than 0.1. This small population of FALSE POSITIVE TCEs with high Disposition Scores were made into KOIs in DR 25.
As part of the DR 25 catalog activity, we simulated a set of known false alarms by searching for transit-like signals in either a scrambled or inverted flux time series dataset. With this we measure the reliability of the KOI catalog against transit-like features caused by instrumental noise (a.k.a. false alarms). This data set shows us that the Disposition Score can be used to identify a more reliable, though less complete, set of planet candidates by only counting CANDIDATE KOIs with a high score. Approximately 7 percent of CANDIDATE KOIs have a score less than 0.75. If removed the reliability across the entire catalog exceeds 90 percent, though completeness suffers by as much as 20 percent at long period and low signal-to-noise, as indicated by our injected transit population. Additionally, one could increase completeness with a minimal hit on reliability by including the few FALSE POSITIVE KOIs with scores above 0.5.
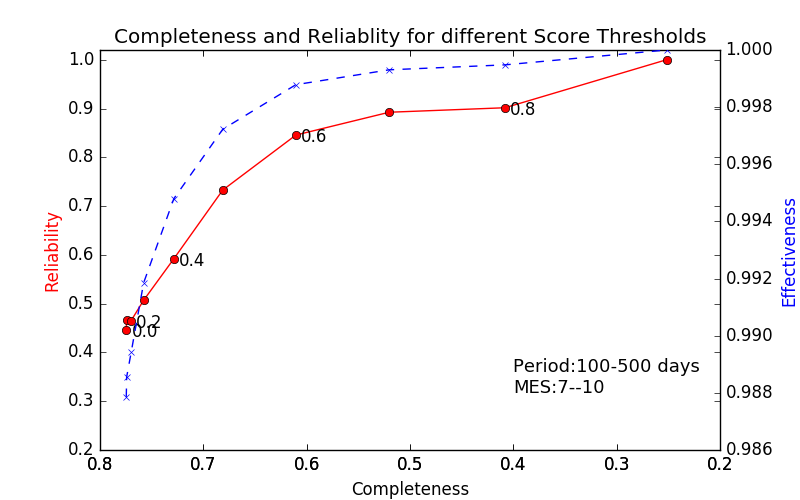
As an example of the Disposition Scores, the figure below shows, in red, the completeness and reliability for KOIs with MES ≤ 10 and periods ranging from 100–500 days for different score thresholds (given by black numbers). The dashed blue line indicates the "effectiveness" at removing false alarms from the known simulated false alarm population for the same score thresholds. Without a score cut, this part of parameter space has a completeness of 77 percent and a reliability of 45 percent. If only CANDIDATES with a score value greater than 0.6 are counted, the reliability of the population exceeds 80 percent, but the completeness drops to about 60 percent. The shorter period, higher MES objects have considerably higher completeness and reliability, both in excess of 95 percent.
Planetary parameters for the majority of KOIs are based upon fitting the Mandel & Agol (2002) transit model to the Q1–Q17 DR 25 PDC flux time series data (DRN25, Thompson et al. 2016) after additional detrending. The fitting procedure is the same as that described in Rowe et al. (2013). To summarize, the procedure assumes a circular orbit and fits for the stellar density, relative photometric zero point, impact parameter, radius ratio, period, and epoch. The stellar parameters (see below) and associated uncertainties are used to calculate values such as planetary radius and insolation flux. To estimate the posterior distribution on each fitted parameter, a MCMC analysis was performed that handles correlations between variables such as stellar density, impact parameter, and radius ratio. The reported error bars are determined from the chains by calculating the one-sigma bounds of the distribution centered on the least-squares fit value for each model parameter. Note that the parameters given in the table are based on the least-square fit model that seeded the MCMC chains, not the MCMC iteration with the smallest chi-square as for previous catalogs. For those cases where the MCMC chains did not converge, the column "Planetary Fit Type" is set to "LS" and no errors are reported. For more information see Rowe and Thompson (2015) and visit the MCMC Posterior Chains to obtain the chains for DR 25).
For some low signal-to-noise false positives, the above fitting procedure was unsuccessful. In these cases the catalog contains the period, epoch, and transit duration, with no error bars, as reported by the original DV report for each TCE. These cases are identified by the column "Planetary Fit Type" being set to "none."
Understanding the stellar population is required in order to understand the planet population found in this transit survey. By combining the works of many published sources, Huber et al. (2014) characterized the entire sample of stars observed by Kepler. The Q1–Q17 DR 25 Stellar Catalog (Mathur et al. 2017) improves upon this work by significantly updating the methodologies and by utilizing new sources of stellar data. Typical uncertainties in stellar radius are ∼27 percent, somewhat smaller than previous stellar catalogs.
KOIs in the Q1–Q17 DR 25 catalog were fit using stellar values from this updated Q1–Q17 DR 25 stellar catalog (Mathur & Huber 2016 and Mathur et al. 2017). These stellar parameters can be accessed via the Kepler stellar data search interface. A few tens of KOIs have no published stellar information; for these, solar parameters are reported in the KOI table. In such cases, the "Stellar Parameter Provenance" column has a value of "solar."